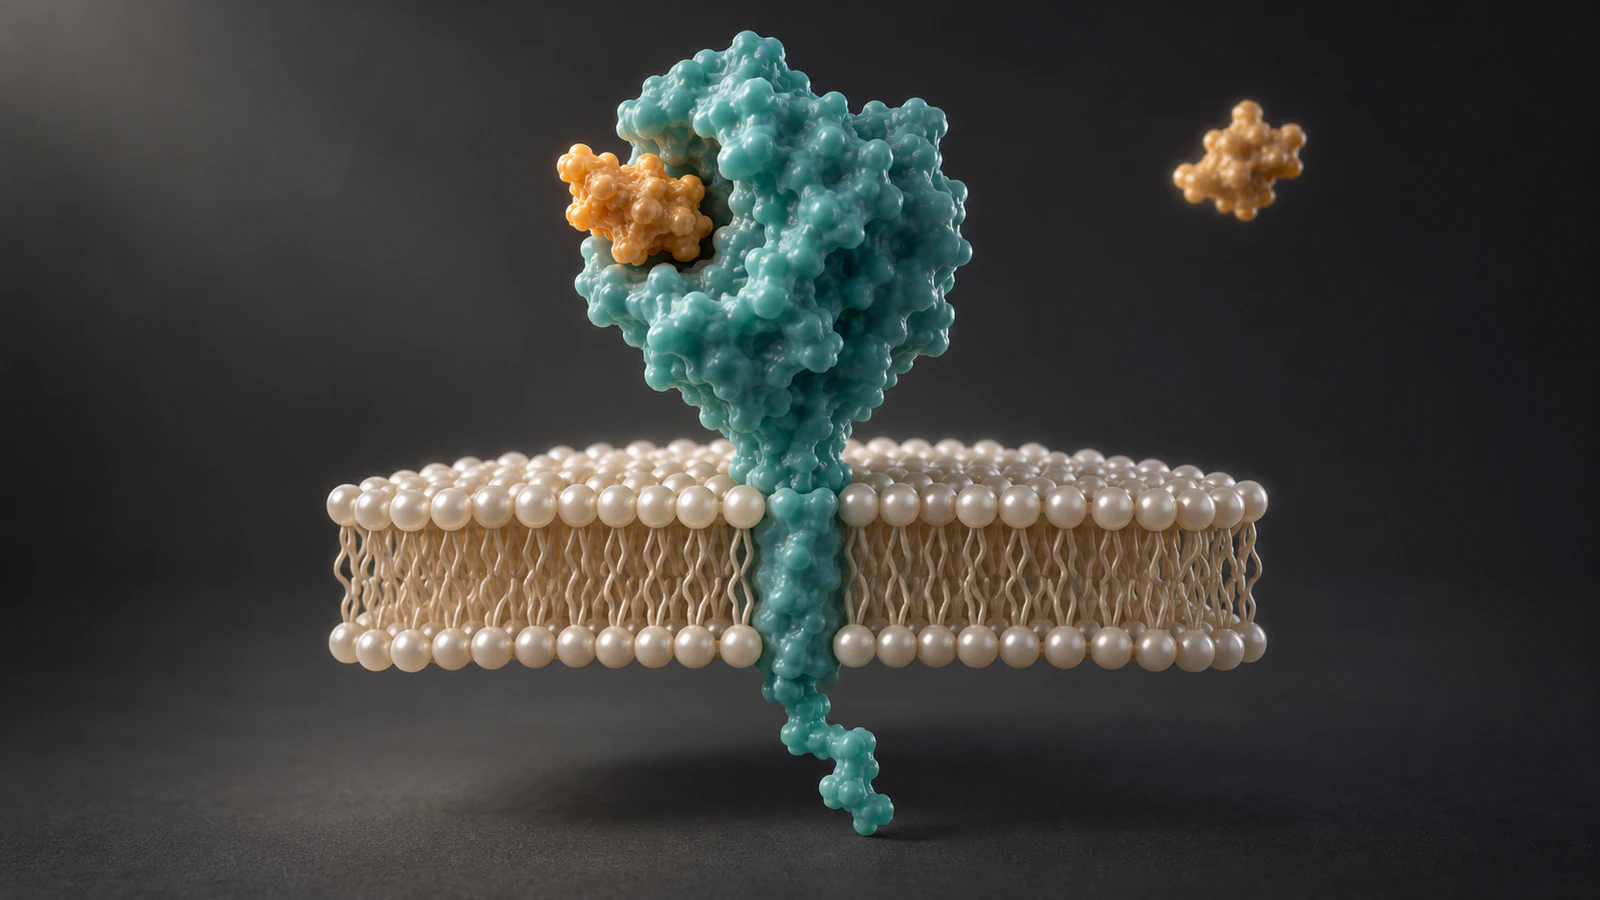
Why twice the ligand is not twice the binding
Doubling free ligand concentration does not generally double receptor occupancy. In a simple one-site equilibrium model, the occupied fraction is [L] / (Kd + [L]). At a free ligand concentration equal to Kd, half the sites are occupied on average. At twice Kd, the expected fraction is two-thirds. Affinity has stayed the same; concentration has changed.
To animate this clearly, keep the receptor population fixed and calculate the comparison states before directing any movement. A twelve-site teaching display can show six occupied sites for the first condition and eight for the second. Those are chosen representative states, not a prediction that twelve real receptors always hold exactly that count.
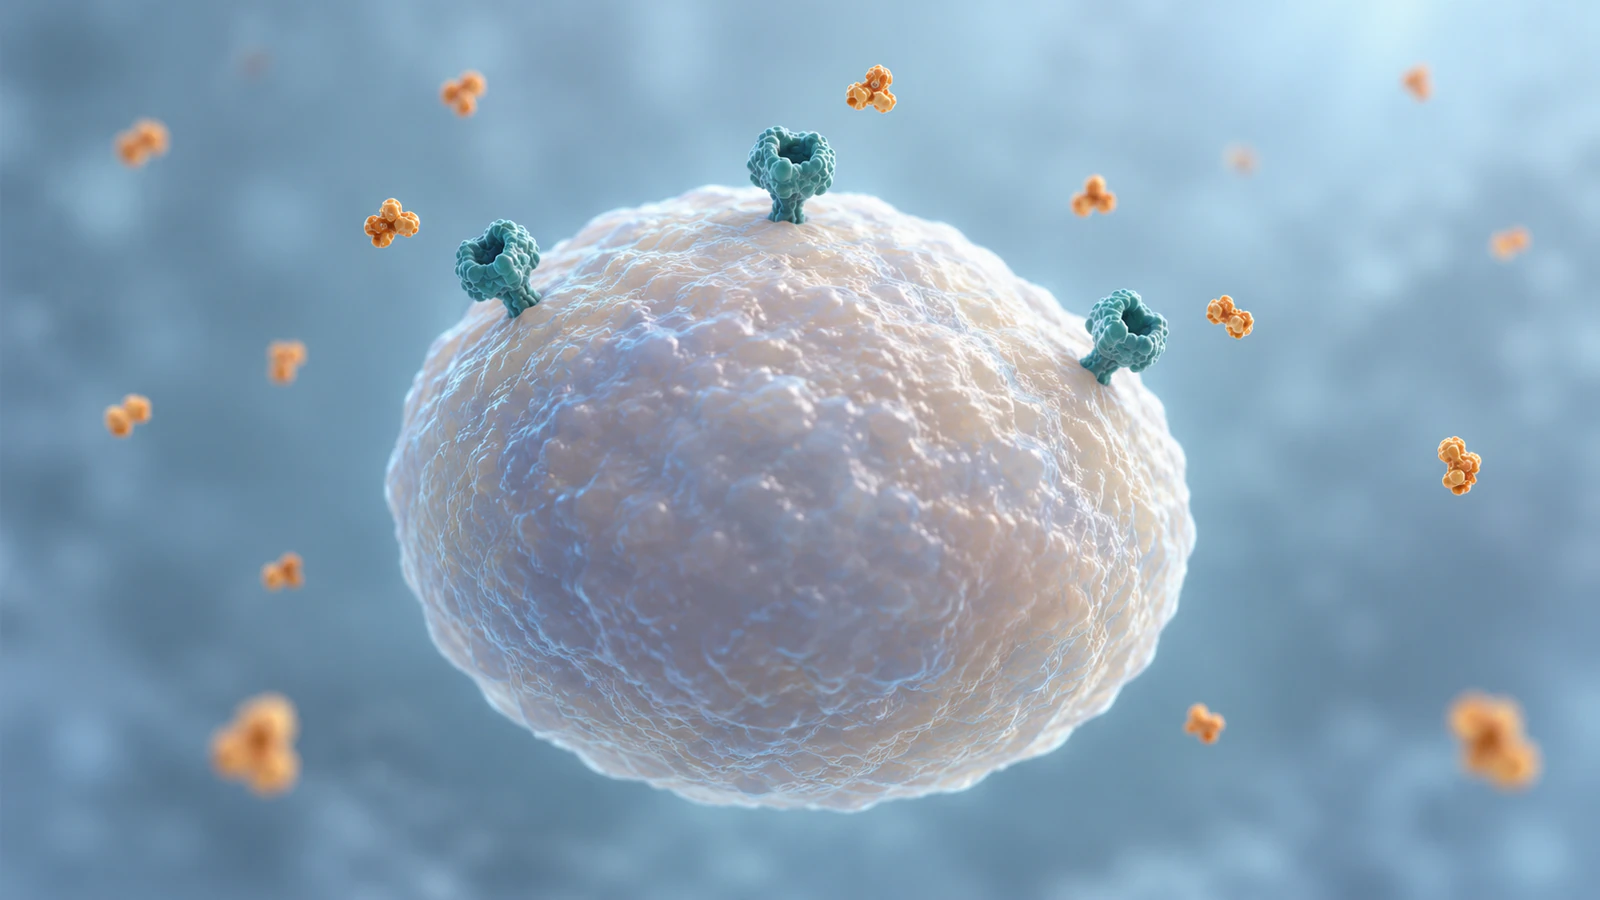
This guide gives teachers and science communicators an original scene plan, calculation table and inspection checklist. The proposed Animiotics prompt has not been executed as a validated binding simulation. The accompanying images are conceptual illustrations rather than measured structures or occupancy data.
Define the model before choosing a receptor
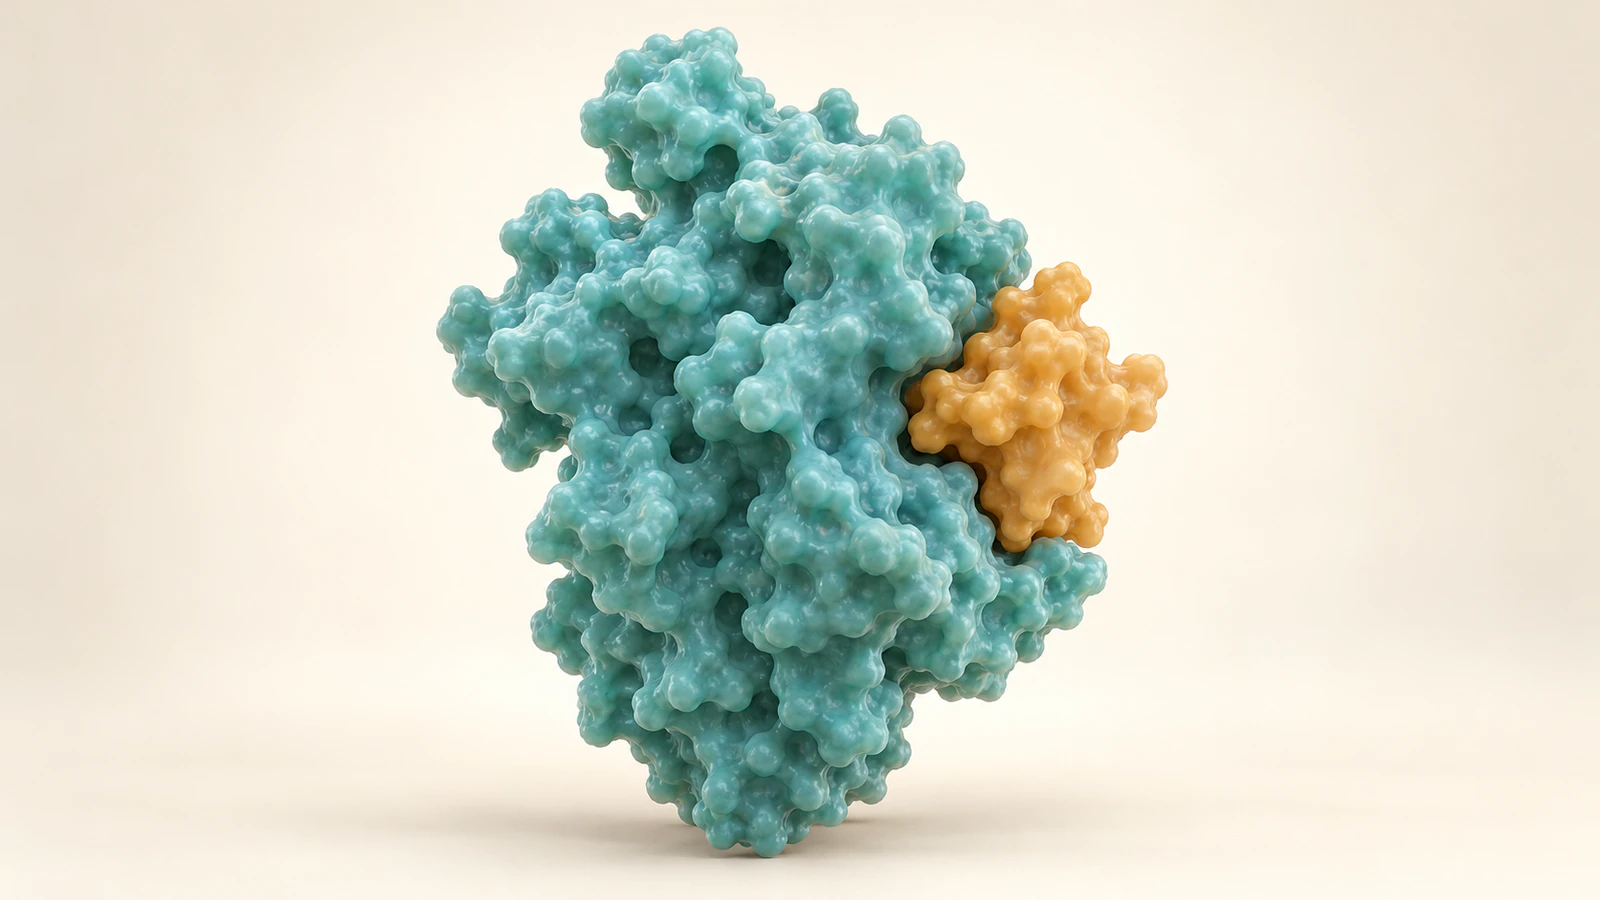
A ligand is a molecule that binds a target. Here, each receptor has one available binding site, all sites follow the same binding model and binding is reversible. Kd is the equilibrium dissociation constant, expressed in concentration units. Within this model, lower Kd means higher affinity.
The GraphPad one-site binding documentation gives specific binding as Bmax × [L] / (Kd + [L]). Bmax is the maximum specific binding capacity. Dividing by that capacity gives the occupied fraction, often written as theta. Both [L] and Kd must use the same concentration units.
Keep the scope narrow: one ligand species, one uniform class of independent sites and no cooperativity, meaning one binding event does not alter another site’s binding behavior. The Assay Guidance Manual also stresses equilibrium and attention to ligand depletion when interpreting saturation binding experiments.
- Use a generic single-site receptor for this lesson. Do not label an invented surface as a particular measured protein.
- Record the model assumptions beside the storyboard so reviewers know which biological complications are deliberately absent.
- For a named receptor, check its actual binding sites, conformations and experimental conditions before applying this simplified display.
Calculate three review states
Choose Kd = 12 nanomolar, abbreviated nM, for an illustrative example. This is an invented teaching value, not a reported measurement for a drug or receptor. A nanomolar concentration is one billionth of a mole per liter. Use free ligand concentrations of 4, 12 and 24 nM.
The arithmetic is 4 / (12 + 4) = 0.25, 12 / (12 + 12) = 0.50 and 24 / (12 + 24) = 0.6667. Multiplying each fraction by twelve gives representative display counts of three, six and eight. The calculations can be checked independently of any animation software.
| Free ligand | Relative to Kd | Expected occupied fraction | Chosen display state |
|---|---|---|---|
| 4 nM | One-third | 25% | 3 occupied of 12 |
| 12 nM | Equal | 50% | 6 occupied of 12 |
| 24 nM | Twice | About 66.7% | 8 occupied of 12 |
Keep the denominator and solution visible
Occupancy is the number of occupied sites divided by the total number of sites being considered. It is not the percentage of ligand molecules that have bound. Keep all twelve receptors within the same review field. If a camera crop hides four unoccupied receptors, the visible scene may suggest a different fraction despite unchanged biology.
The concentration in the equation is free ligand in solution, not automatically the total amount added. Binding can remove ligand from that free pool. For this teaching model, assume a sufficiently large reservoir maintains each stated free concentration; do not portray twelve receptors consuming a tiny closed supply and still call that supply constant.
A few floating ligand objects can indicate the surrounding solution. Their screen count does not establish nanomolar concentration because the scene lacks a calibrated volume and complete molecular population. Put the actual condition in the narration or slide caption. If visual crowding is used as a cue, explain that it is illustrative.
Separate occupancy, affinity and response
Across the three conditions, keep Kd and receptor appearance unchanged. Do not make the high-concentration ligand larger, brighter or more deeply embedded. Those edits can imply a different molecule or stronger individual contact. Use the number of occupied sites to communicate the comparison.
Do not turn every occupied receptor into an equally bright intracellular signal. The IUPHAR receptor teaching resource distinguishes ligands that activate receptors from those that block them and discusses systems with spare receptors. Binding occupancy alone does not specify a functional response. Likewise, a concentration giving half-maximal response, EC50, need not equal the binding Kd.
This distinction is a documented teaching problem, discussed in Colquhoun and colleagues’ affinity-efficacy paper. Keep the present lesson about binding. If a later sequence covers signaling, introduce its evidence and model separately. For multivalent antibody contacts, use the separate affinity versus avidity guide before adapting this example.
Plan six shots with fixed comparison views
Start with a contact close-up, then use a stable population view for counting. An arrangement of three loose rows of four receptors is an editorial device that makes twelve sites easy to audit. It is not a claim about membrane organization. Keep spacing, scale and camera position identical at the three endpoints.
The holds below are chosen viewing durations. They do not describe how quickly a real system reaches equilibrium. A cut or fade between conditions is safer than an unexplained burst of incoming ligand that appears to establish a measured association rate.
| Shot | Visible action | Review requirement |
|---|---|---|
| 1: Establish the site | Show one ligand contacting one receptor | Separate objects meet without passing through each other |
| 2: Establish the population | Reveal all twelve receptor sites | Every site remains identifiable |
| 3: Low concentration | Hold the chosen 3-of-12 state | Narration states 4 nM free ligand and fixed Kd |
| 4: Midpoint | Cut to the chosen 6-of-12 state | Same denominator, framing and receptor geometry |
| 5: Double the midpoint | Cut to the chosen 8-of-12 state | Explain 50% to about 67%, not 100% |
| 6: Ask for a prediction | Return to the midpoint view | Ask what changes if concentration falls again |
Turn the plan into an Animiotics prompt
The current Animiotics homepage offers a describe, build, edit and export workflow and shows a cell-surface receptor-binding example. Use that workflow to request a conceptual teaching scene. Calculate the values outside the generator and check the returned objects against the storyboard; a written number in a prompt does not establish that the result contains that number.
Proposed prompt: Create a conceptual receptor-occupancy lesson on one membrane patch. Show twelve identical teal single-site receptors in three readable rows of four and smaller amber ligand objects. Keep receptor shape, size, spacing and camera unchanged across three separate review states. Show three occupied sites, then six, then eight. Each occupied site has one ligand touching its exterior pocket without overlap. Use clear cuts between conditions rather than implying measured binding speed. Keep signaling, internalization and receptor production out of this scene.
Before generating, save the calculation table and identify which frame should display each count. After the scene is built, inspect the twelve receptor objects and each ligand contact. Request a correction for the specific state that fails. If count control remains unreliable, use the animation for the single-site explanation and place the verified numerical comparison beside it in your teaching material.
That fallback preserves the lesson without presenting an attractive but incorrect population as quantitative evidence. For a broader evidence-to-scene method, consult the biology animation storyboard guide.
Review motion without inventing kinetics
Equilibrium does not mean molecules have stopped binding and leaving. It describes a balance at the population level. A frozen endpoint is therefore a teaching snapshot. Explain this in narration, or show a separate qualitative exchange shot that allows occupancy to fluctuate without assigning real seconds.
Kd alone cannot set the timing of individual contacts. In a simple single-step binding model, Kd = koff / kon, relating dissociation and association rate constants. Different rate pairs can have the same ratio. The Assay Guidance Manual’s kinetic analysis treats these rates as quantities requiring appropriate measurements.
Do not solve a pacing problem by making all ligands detach simultaneously. That looks coordinated and changes the biological story. Keep the numerical endpoint sequence separate from the optional exchange illustration, and label the latter qualitative. Use a longer editorial hold when students need time to count.
Catch the mistakes that change the lesson
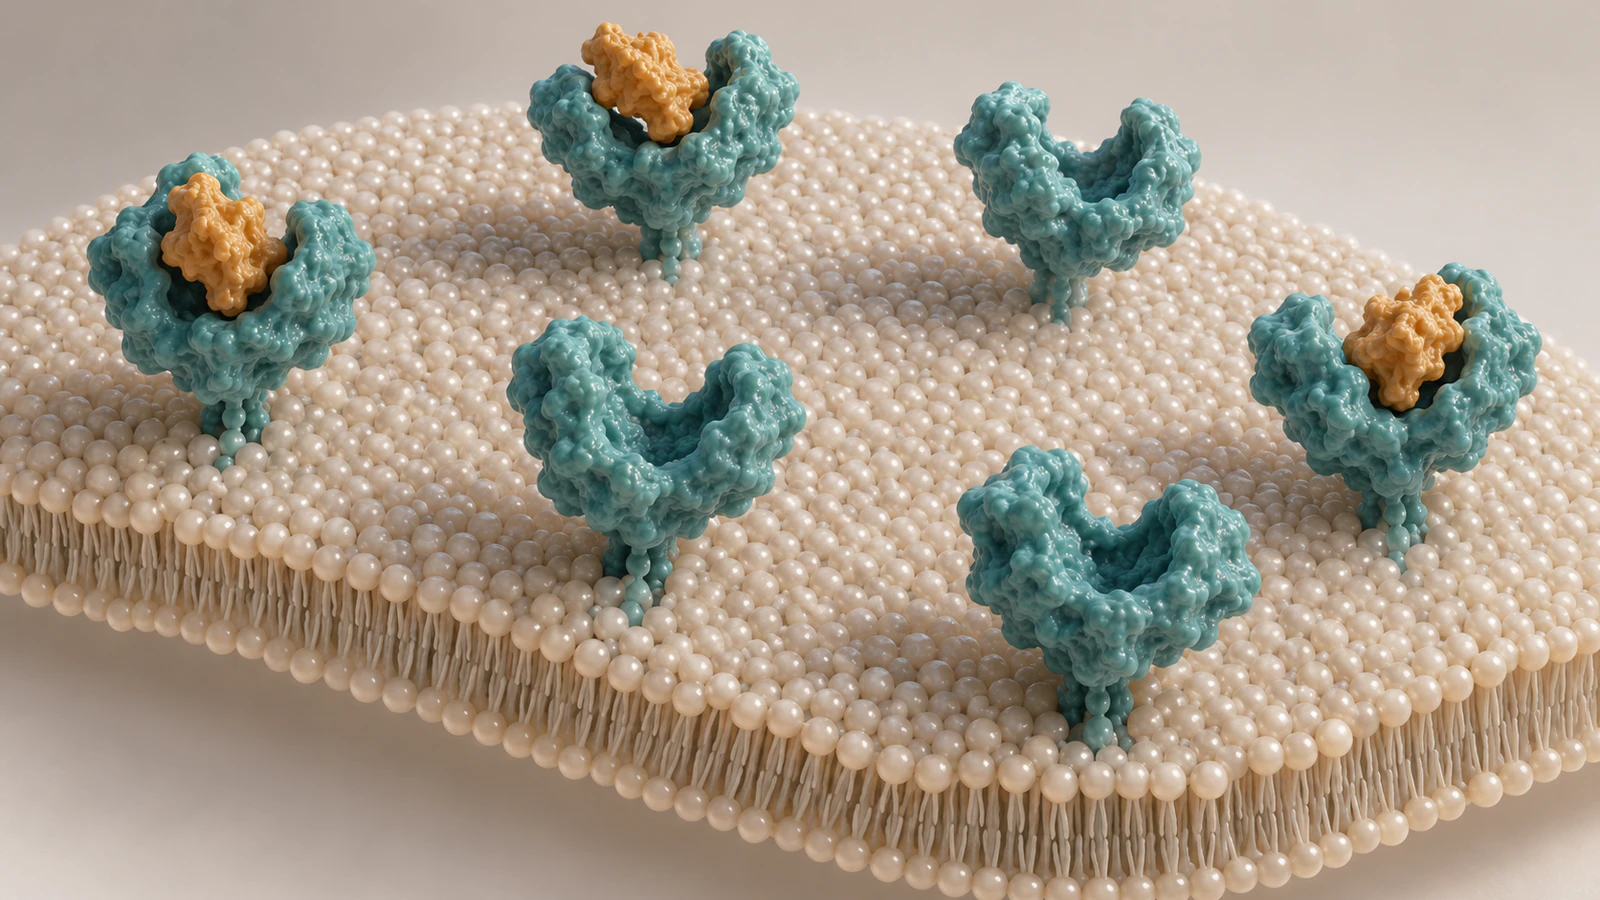
Review a plain viewport or still before polishing the lighting. The most useful failures to catch are a changed denominator, an ambiguous contact and an unsupported signal. Reviewers should be able to point to the exact object or statement that needs correction.
| Failure | Why it misleads | Correction |
|---|---|---|
| Eight sites visible instead of twelve | The apparent denominator has changed | Restore the common field before comparing conditions |
| Two ligands on one site | The assumed one-site model is no longer represented | Retain one bound ligand and move the other into solution |
| Ligand passes through the receptor | Contact and overlap become indistinguishable | Adjust position and inspect the contact from another angle |
| More ligand also enlarges receptors | Concentration and receptor properties change together | Lock geometry across states |
| Every site remains permanently occupied | Saturation is confused with irreversible binding | Use representative endpoint holds with an equilibrium explanation |
| 50% binding is labeled 50% response | Occupancy is being substituted for function | Remove the response claim or supply a separate supported model |
Use a prediction question and an honest caption
Pause at the six-of-twelve state before revealing the next condition. Ask: “If free ligand doubles while Kd stays fixed, will three-quarters, two-thirds or all sites be occupied on average?” Then show the calculation and the eight-of-twelve display. The question tests the relationship between concentration and the denominator, not recognition of a brighter image.
Ask a second question: “Can this frame tell us the biological response?” A correct explanation should identify the missing functional model. The IUPHAR pharmacodynamics overview describes response in terms of both the ligand and the biological system; a count of visible contacts is not a complete response measurement.
Suggested caption: Conceptual one-site equilibrium binding lesson. Illustrative Kd = 12 nM; free ligand concentrations of 4, 12 and 24 nM give expected occupancies of 25%, 50% and about 66.7%. The twelve-site views are selected teaching representations, not experimental snapshots. Shapes, particle density and motion timing are schematic. No biological response is inferred.
Retain the calculation sheet, reviewed endpoint frames and final caption with the exported teaching material. If a reviewer later changes the receptor identity or adds a second binding site, revisit the model before reusing the counts.
FAQ
Does doubling ligand concentration double occupancy?
Not generally. For this one-site equilibrium example, increasing free ligand from Kd to 2Kd changes the expected occupied fraction from one-half to two-thirds. The answer depends on the starting concentration and the binding model.
Does 50% occupancy mean 50% of the ligand is bound?
No. Occupancy uses receptor sites as its denominator. The fraction of ligand bound uses the ligand population and is a different quantity.
Can I use total ligand concentration in the equation?
Only when it is an appropriate approximation to free ligand under the conditions being modeled. Significant ligand depletion makes that substitution unreliable.
Are the twelve receptors a simulation?
No. They are a small illustrative display of calculated average fractions. Actual finite populations fluctuate, and the generated scene has not been validated as a stochastic binding simulation.
Can Kd tell me how long to hold a binding contact?
No. Kd alone does not determine association and dissociation rates. Choose viewing duration for the lesson and avoid presenting it as molecular time.
Try a receptor-binding teaching scene
Begin with the smallest useful animation: one ligand approaching one available receptor site, followed by a clear view of the contact. Then attempt the reviewed population states if they support your lesson. Keep the calculation table beside the scene while you inspect it.
You can try planning this scene from the Animiotics homepage. Sign-up and the manual editor are free; AI generation and exports require a paid plan under the current homepage terms. Scientific interpretation and endpoint counts still need your review.