Explain the measurement first
A useful qPCR animation separates three layers: DNA amplification, the fluorescence measured during the reaction and the analysis used to estimate starting material. In a fixed-threshold example, Cq is the cycle at which the processed fluorescence curve crosses a chosen threshold. It is not a count of the molecules visible in an animation, and a brighter final tube is not automatically evidence of more starting target.
This guide is for researchers making a lab-meeting or methods-training explanation. It uses a conceptual dye-based quantitative polymerase chain reaction, or qPCR, to plan a sequence you can create in Animiotics. The aim is to help a colleague explain the measurement correctly before looking at actual assay results.
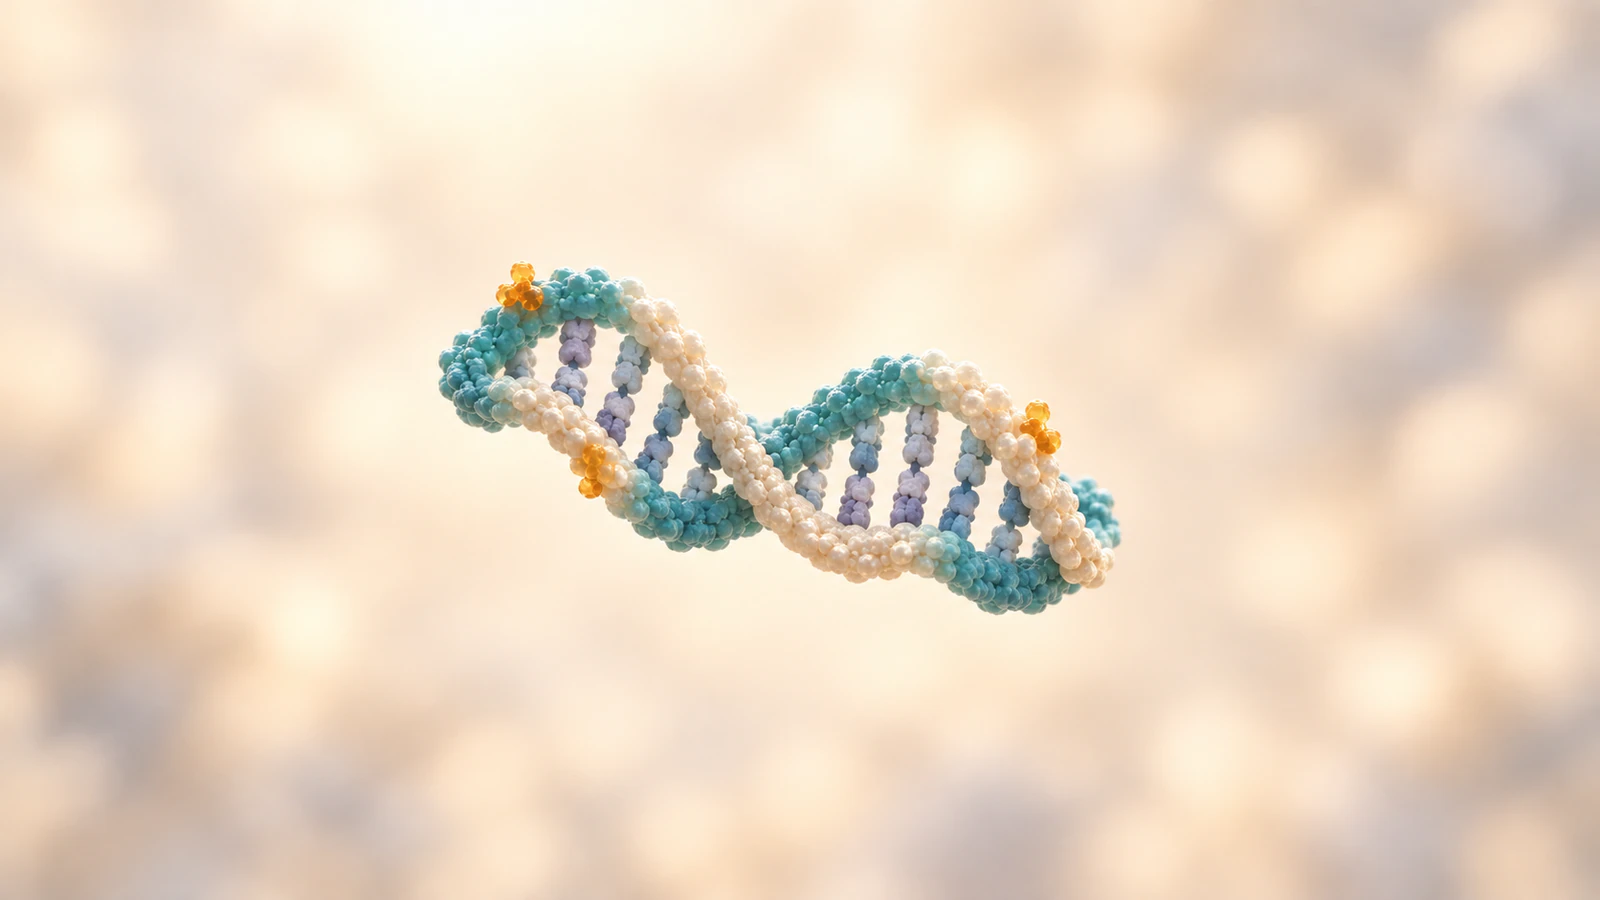
The molecular images are conceptual illustrations. Their shapes, colors and visible molecule counts are not experimental structures or measured reaction compositions. An AI-generated scene can make the explanation easier to inspect, but it still needs a scientific review.
Choose one chemistry
Write the assay type at the top of the production brief. This example uses a double-stranded-DNA-binding dye such as SYBR Green, rather than a sequence-specific hydrolysis probe. Mixing the two detection stories would make an attractive animation scientifically confusing.
The Thermo Fisher chemistry guide explains that the dye associates with double-stranded DNA and fluorescence increases as double-stranded product accumulates. It also notes that nonspecific products require checking. Those two ideas belong together in the explanation: the visual signal is informative, but it does not identify every product by sequence.
Keep the first draft deliberately narrow. Show a conceptual DNA target and dye-associated signal, then reserve separate narration for the interpretation. If the real project begins with RNA, identify the reverse-transcription step in the brief instead of silently presenting RNA as the DNA template. Do not add that extra pathway just to make the scene more elaborate.
Separate objects from readouts
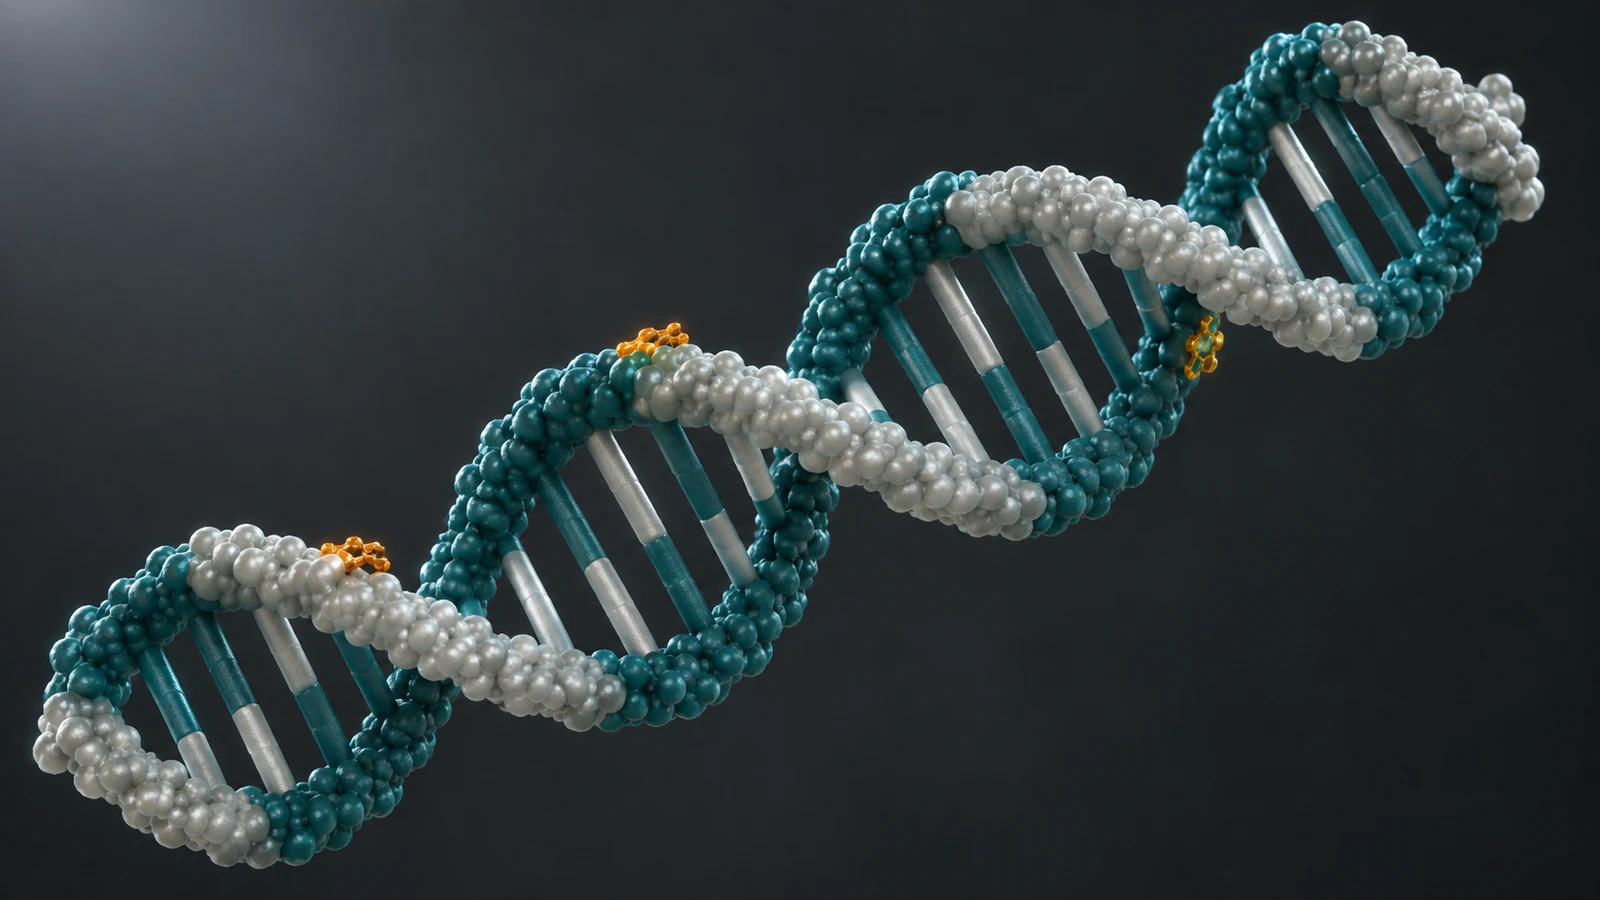
Give each element a job. The duplex represents double-stranded DNA product. A small contrasting accent represents the detection chemistry. A later plot represents processed instrument data. These are different representational layers, so they should not slide into each other without an explicit transition.
For example, avoid turning individual glowing molecules into points on an amplification curve. That visual move suggests a one-to-one count that the illustration has not established. End the molecular shot, state that the view is conceptual, then introduce the plotted signal with its own axes and provenance.
Use the molecular scene to explain a relationship, not to decorate an unexplained graph. Ask whether a viewer could identify the DNA if every glow effect disappeared. If not, the light has become the subject and the chemistry has become background. The distinction should survive a paused frame and a small presentation window.
Make a three-layer record
Before generating a scene, make a small record that connects the assay to its visual explanation. This is a production aid, not a substitute for an assay protocol or analysis report. It helps the scientific reviewer find the point where an illustration might accidentally become a quantitative claim.
For every layer, save the source and the unresolved question. A blank field is useful: it shows which detail should remain unspecified in the animation. Do not fill a missing efficiency value, target sequence or acquisition setting with a plausible-looking invention.
| Layer | What to record | What the animation may show |
|---|---|---|
| Reaction | Target, chemistry and biological starting material | A conceptual product and the chosen detection relationship |
| Measurement | Instrument output, processing and acquisition context | A separate optical-readout explanation with units when known |
| Inference | Analysis method, efficiency and relevant controls | Only the comparison supported by that analysis |
| Illustration | Geometry, colors, visible counts and timing | Declared teaching choices that are not assay measurements |
Keep the laboratory scale honest
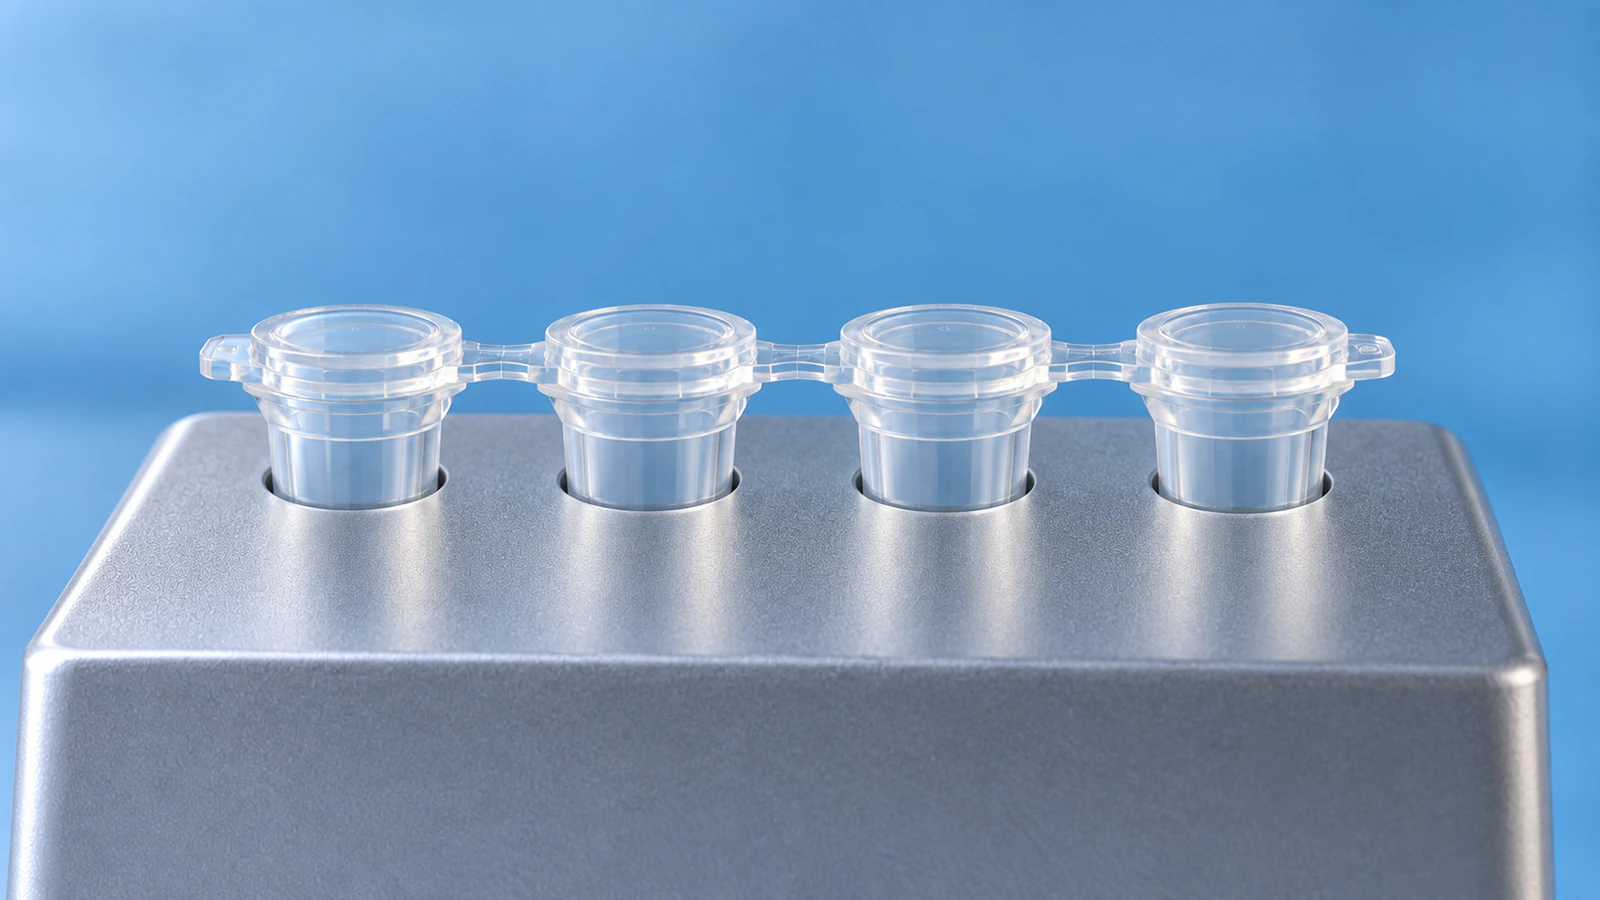
Use a short laboratory establishing shot to show that the reaction belongs in a defined vessel. Then cut to the molecular explanation. A clear change of scale is easier to understand than a continuous camera dive that places a giant DNA helix inside a transparent tube.
The four-tube image here is a conceptual context view. It does not specify a manufacturer's instrument, an optical path or an experimental plate layout. For an actual protocol presentation, use the verified vessel and instrument format from the experiment rather than treating this illustration as a hardware reference.
Keep sample identity outside decorative lighting. If the presentation compares conditions, maintain those identities in the narration, captions and actual data. Do not use tube brightness as an unsupported proxy for concentration. A shared neutral appearance can be more informative because it leaves the comparison to the evidence.
Introduce Cq at the right moment
First explain what changes during amplification, then show how a readout is summarized. In the fixed-threshold method used here, the threshold is placed above background within the exponential portion of the amplification curve. The crossing gives Ct, also commonly called Cq in this context, as described in the instrument amplification-plot documentation.
Make the threshold a visible analysis choice in the data portion of the presentation. It is not a physical barrier inside the tube. A molecule should never collide with a horizontal line to announce that the sample has crossed it.
Specify that this is a fixed-threshold explanation. Software can use other approaches, so the scene should not claim to represent every Cq algorithm. When showing real data, preserve the method used for that experiment. When showing a teaching plot, label it illustrative and keep it separate from evidence of assay performance.
Do not rank samples by raw Cq
An earlier crossing can be consistent with more starting target under comparable, validated conditions. It is not a universal ranking rule across unrelated assays, chemistries or analysis settings. Bio-Rad's qPCR analysis guide explains that threshold placement, reaction composition and efficiency affect interpretation of raw Cq values.
In a scene comparison, keep the assumptions attached to the comparison. If you show two hypothetical reactions, say what is held constant and what is being varied. Do not let a camera cut hide a change in chemistry while the narration continues as though only starting material changed.
A useful review exercise is to remove the sample names and ask what the viewer can conclude from the scene alone. If the answer is an exact fold difference, ask where that number came from. Without the appropriate analysis, replace the conclusion with the narrower observation the visual actually supports.
Build a six-shot explanation
The following sequence is an original production plan for a short methods explainer. It is not a record of a performed experiment or a tested Animiotics generation. Its value is in keeping the reaction, readout and interpretation distinct while giving the viewer a clear path through them.
Allocate time by conceptual difficulty. The transition from molecular product to fluorescence analysis usually deserves a deliberate pause. A rapidly multiplying cloud of DNA may look dynamic, but it can consume the time needed to explain what Cq actually means.
| Shot | Visible idea | Review question |
|---|---|---|
| 1. Context | A defined reaction vessel, then a clear cut in scale | Is the vessel illustrative or experiment-specific? |
| 2. Product | A recognizable double-stranded DNA segment | Can the viewer distinguish the product from the detector? |
| 3. Detection | Small dye-associated cues on the duplex | Does this incorrectly imply sequence-specific recognition? |
| 4. Accumulation | Several separate product molecules | Are the visible counts clearly nonquantitative? |
| 5. Readout | A separately prepared, sourced or illustrative amplification plot | Are axes, processing and threshold method clear? |
| 6. Interpretation | The supported comparison plus its conditions | Have efficiency and controls been considered before the claim? |
Show what the endpoint cannot prove
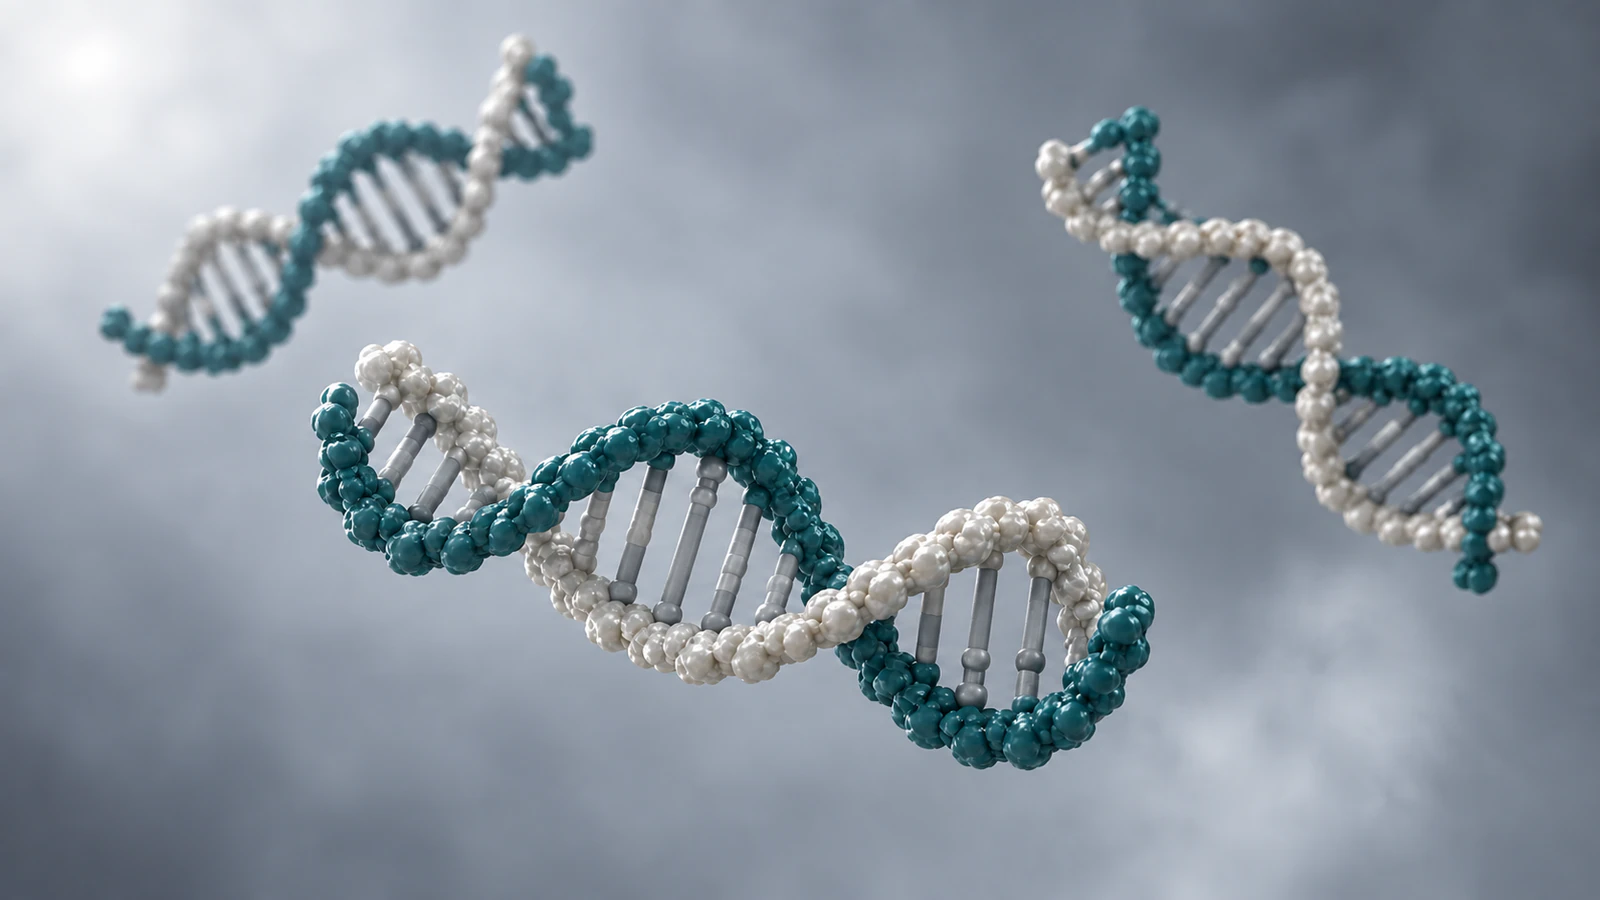
The final molecular frame should leave room for a question: what else would we need to know before interpreting this reaction? Several DNA products in view explain accumulation. They do not establish the identity of all products, the starting quantity or the quality of a comparison.
The MIQE 2.0 authors' summary emphasizes transparent experimental reporting and efficiency-corrected target quantities, with prediction intervals, detection limits and dynamic ranges appropriate to the quantification method. A short animation cannot carry the whole analysis, but it can avoid contradicting those requirements.
End the mechanism segment before making the quantitative conclusion. In a research talk, the next slide can carry the actual controls, analysis and uncertainty. In training, it can ask which evidence is still missing. This gives the attractive endpoint a scientific purpose without presenting it as proof of a successful assay.
Direct the draft in Animiotics
Start with a small molecular scene rather than asking for a complete instrument, reaction and data analysis in one generation. Animiotics currently supports creating editable scientific 3D scenes from written descriptions and refining them with follow-up requests. Its homepage states that AI generation and exports require a paid plan; joining is free.
A starting brief could read: Create a conceptual double-stranded DNA product with a few small dye-associated cues. Keep the whole duplex visible. Use a restrained teal, pearl and amber palette. Do not show a sequence, a measured concentration, a plotted result or an exact dye-binding geometry. This is a proposed direction to review, not a promise that one prompt will produce a validated scientific scene.
After inspecting the first draft, request one correction at a time. For example: keep the DNA geometry and camera, but make the detector cues smaller and visually separate from the bases. Use the scientific animation prompt guide to specify the invariant relationships. For close views of nucleic acids, the DNA direction guide covers a different review task: keeping strand orientation consistent.
Review the implied claim
Watch the draft once without narration. Write down what you think it claims. Then compare that sentence with the intended message. If the silent version implies that all DNA is the desired target, that every cycle is perfectly efficient or that the brightest tube wins, revise the visual before adding more explanation.
Next inspect the molecular-to-data transition at normal speed. A disclaimer on the last frame cannot repair an earlier visual that looks like measured evidence. Put the distinction where the audience needs it: immediately before the plotted readout or quantitative comparison.
Finally ask a colleague to explain Cq back in their own words. A successful draft should help them distinguish a reaction from its readout and its interpretation. Save the source record, the reviewed scene version and any unresolved assay-specific questions together so a later edit does not lose those boundaries.
Frequently asked questions
Is Cq the same as a DNA copy number?
No. Cq is an analysis result expressed in cycles. Estimating starting quantity requires an appropriate quantification method and assay validation; counting the illustrated molecules cannot supply it.
Can a qPCR animation use Ct instead of Cq?
Yes, when that matches the terminology and method being explained. Define the term once and use it consistently, especially when showing software output from a particular experiment.
Does dye fluorescence prove the correct target amplified?
No. A double-stranded-DNA-binding dye does not by itself establish product sequence identity. Keep specificity checks separate from the conceptual signal animation.
Should the animation show exact doubling every cycle?
Only as an explicitly stated idealized model. Do not present a perfectly repeating visual as a measurement of the efficiency of a real reaction.
Can Animiotics validate my qPCR analysis?
This guide uses Animiotics to create and edit an explanatory scene. It does not claim that the product validates assay data, calculates a defensible quantity or replaces scientific review.
Try one assay explanation
Create the product-to-signal segment first: a clear duplex, a restrained detector cue and a transition that leaves quantitative interpretation to the evidence. Review that short sequence with a colleague before expanding it into the six-shot explanation. Try Animiotics with this focused scene plan, then refine the geometry and timing around the question your audience needs answered.