Calibrate before adding the bar
To add an ImageJ scale bar, first verify the physical distance represented by each pixel in Image > Properties. If calibration is missing, establish it from reliable acquisition metadata or a stage-micrometer image acquired with matching settings. Then use Analyze > Tools > Scale Bar. Crop or resample your presentation copy before placing the final bar, verify its length and inspect the exported figure.
A crop changes the field you show; resampling changes the pixel grid. Confusing those operations can produce a convincing but incorrect label. This guide gives documented ImageJ and Fiji steps plus an illustrative calculation. The four accompanying CGI images explain the context; none is a calibrated micrograph or measurement.
Prepare the image and its calibration record
Keep the acquisition file unchanged and work on a duplicate. Collect the image dimensions in pixels, physical pixel width and height, units, objective and relevant acquisition settings. Include camera binning and additional zoom when applicable. An objective label alone does not establish the specimen distance represented by a pixel.
Open the source in ImageJ or Fiji using the appropriate reader. Check Image > Properties instead of assuming an exported TIFF retained its metadata. The ImageJ annotation guidance describes calibration loss during export and the need for matching acquisition settings when using a stage micrometer.
These instructions use the ImageJ 1.x menu commands documented on the official site, also used in Fiji. Some dialog wording varies by release; record your installed version. The numerical example below is a teaching choice, not calibration supplied with a biological specimen. The menu procedure was checked against documentation, not executed in a local ImageJ session.
Set scale from a known distance
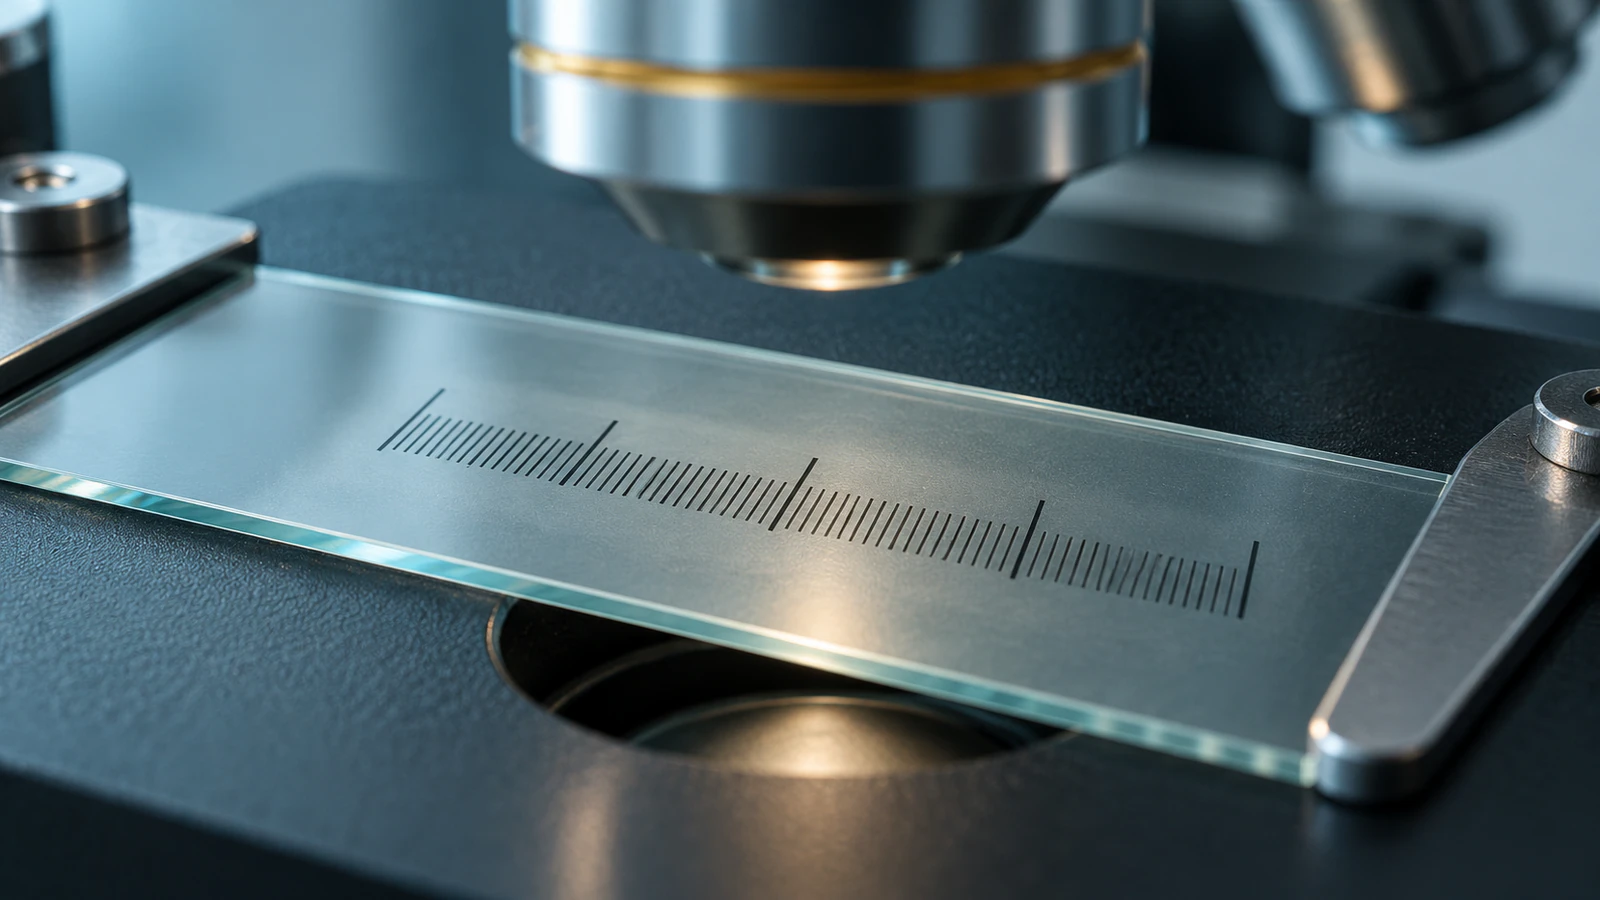
If the image already has trustworthy spatial metadata, preserve it and check a known reference where available. If it is uncalibrated, open the corresponding stage-micrometer image. A stage micrometer is a slide with physical graduations of known spacing. Use the straight-line selection tool across a known interval, choosing clear endpoints.
Open Analyze > Set Scale. ImageJ fills Distance in Pixels from the selected line. Enter the interval in Known Distance and its unit in Unit of Length. For square pixels, Pixel Aspect Ratio is 1.0. Leave Global unchecked unless every image receiving that calibration was acquired with the same applicable settings. These controls are described in the Analyze menu documentation.
Apply the verified calibration to the matching specimen image, then reopen Image > Properties to confirm the units and pixel dimensions. The spatial-calibration tutorial demonstrates this reference-to-specimen transfer. Do not transfer a calibration just because two files look similar or share the same objective name.
Separate a crop from a resize
In the working copy, make a rectangular selection and choose Image > Crop. This keeps a smaller portion of the original pixel grid. A simple crop without resampling preserves the physical spacing between retained pixels. Record the selected region so another person can locate it in the original image.
Image > Scale changes the number of pixels representing the field. The ImageJ guide documents horizontal and vertical scale factors, interpolation and creating a new output window. For an ordinary figure resize, use equal horizontal and vertical factors so shapes retain their proportions.
An enlarged display is a third operation. The zoom controls change the on-screen view without defining a new specimen calibration. A cell that fills more of your monitor has not become physically larger. Keep these three operations separate in the processing record: crop coordinates, resampling dimensions and display zoom.
Check the numbers after resampling
Suppose an original image is 2,000 by 1,200 pixels with square pixels representing 0.10 micrometers each. These values are illustrative. Its field is 200 by 120 micrometers, and a 10-micrometer bar spans 100 pixels. The calculation is bar length in pixels = physical bar length divided by physical pixel size.
Make two separate copies of that original. Crop one to 1,000 by 600 pixels without resampling: its field becomes 100 by 60 micrometers, but a 10-micrometer bar still spans 100 pixels. Resize the other whole image to 1,000 by 600: its field remains 200 by 120 micrometers, so each output pixel represents 0.20 micrometers and the bar spans 50 pixels.
For a uniform resize, new pixel size equals old pixel size divided by the resize factor. Inspect Image > Properties after processing. If the metadata disagrees with the known operation, resolve the discrepancy before generating a bar. Copying the original 0.10 value into a half-width resampled image would be wrong.
| Independent output | Pixel size | Field width | 10-micrometer bar |
|---|---|---|---|
| Original: 2,000 pixels wide | 0.10 micrometers/pixel | 200 micrometers | 100 pixels |
| Crop: 1,000 pixels wide | 0.10 micrometers/pixel | 100 micrometers | 100 pixels |
| Whole-image resize: 1,000 pixels wide | 0.20 micrometers/pixel | 200 micrometers | 50 pixels |
Place an editable scale bar
Once the presentation copy has its intended crop and pixel dimensions, open Analyze > Tools > Scale Bar. Set the physical width, bar thickness, label size, color and location. Choose a readable distance that suits the field without covering the feature the reader needs to inspect. Confirm that the dialog uses the expected physical unit rather than pixels.
Use the Overlay option to keep the annotation separate from image pixels while arranging the figure. The ImageJ scale-bar documentation describes this behavior. Retain the editable working copy, then choose Image > Overlay > Flatten to create a separate RGB presentation copy with the annotation embedded.
Inspect both the label and the bar. A correct-looking number does not prove the line has the correct length. For the half-width worked example, the horizontal bar should span 50 output pixels before any later page-layout scaling.
Verify the exported figure
Save the calibrated working image and record the output settings. ImageJ supports TIFF and PNG through File > Save As; consult its file-format documentation for the available commands. Preserve the original quantitative data separately from the presentation copy with annotations.
Reopen the exported file. Check that the bar and unit label are present, the image dimensions match your record and no overlay disappeared. Inspect the result at the size it will occupy in the manuscript, slide or poster. A label that is readable while zoomed in may become too small after page layout.
In a layout application, resize the image and its attached bar together, keeping their proportions locked. The physical distance written beside the bar stays the same. ORI guidance on magnification explains why a scale bar survives such proportional resizing while a stated display magnification does not.
Fix common scale-bar failures
When a bar looks implausible, return to the calibration record before changing its visual length. The table separates the symptom from the evidence needed to correct it. A prettier annotation cannot repair an unknown acquisition scale.
Avoid repeated resampling while trying different layouts. Each resampling operation changes how pixel values are represented. ORI guidance on pixels discusses the consequences of changing image dimensions. Keep measurements tied to the appropriate original data and treat the resized copy as a presentation output.
| Symptom | Likely issue to investigate | Correction |
|---|---|---|
| The bar is labeled in pixels | Missing or unread calibration | Recover metadata or a matched reference before adding physical units |
| A 10-micrometer bar doubles after resize | Original pixel size copied to a resampled file | Recalculate from the actual resize factor and check properties |
| The export has no bar | Overlay was not included | Export a separate flattened presentation copy and reopen it |
| Cells look stretched | Unequal horizontal and vertical scaling | Return to the original and resize proportionally |
| Inset and overview share one ambiguous bar | Different displayed fields or scales | Give each independently scaled panel a verified bar |
Audit each panel before submission
Use one record per panel, including closeup insets. Write the source filename, acquisition calibration, crop region, output dimensions, processing steps, bar distance and expected bar length in output pixels. Add the software version and exported filename. This is an audit trail, not a substitute for the acquisition metadata.
For the illustrative resized panel, a useful record reads: source 2,000 by 1,200 pixels; 0.10 micrometers per pixel; no crop; uniform resize to 1,000 by 600; output 0.20 micrometers per pixel; bar 10 micrometers, 50 pixels. A caption can state the bar distance and relevant processing without burying readers in the entire record.
Ask a colleague to reproduce the bar calculation from that record. Check that the crop preserves the context needed for the scientific claim. If the figure combines observed images with a proposed explanation, separate them visibly and describe their different evidence status, as in our grant figure guide.
Keep conceptual animation separate from measurement
A microscopy panel reports an acquired field. A conceptual animation can explain what viewers should notice, but its apparent dimensions do not supply a microscopy calibration. Our biology storyboard guide provides a way to connect each explanatory shot to a specific supported claim.
For a companion Animiotics scene, propose three shots: a stationary spread cell with its nucleus visible; a camera move toward the nucleus while the cell geometry stays unchanged; then a return to the original framing. This teaches the difference between changing a view and changing an object. It is a suggested scene plan, not a tested prompt or measured cellular trajectory.
Start with a written scene description, then review the objects and camera timing in Animiotics. Keep experimental images in the figure workflow that preserves their calibration. Do not place a micrometer label on an illustrative cell unless you have independently established and checked the scene scale.
FAQ
Does cropping change the scale bar?
A simple crop without resampling preserves pixel spacing, so the same physical bar has the same pixel length in the cropped image. If you subsequently enlarge that crop for display, resize its bar with it or regenerate the bar from verified calibration.
Can I use the objective magnification to set scale?
Not by itself. Use reliable image metadata or a reference acquired under the applicable settings, including camera binning and additional zoom. The number printed on an objective does not account for the complete acquisition and export path.
Should I add the bar before or after resizing?
Adding it after the final image resampling makes text size and thickness easier to control. Verify the output calibration first. A bar already embedded in an image remains meaningful when the complete image and bar are resized together proportionally.
Why is my white bar green?
A lookup table can display high-intensity pixels as a color. ImageJ documents converting a pseudocolored presentation copy to RGB before adding an annotation that must remain white. Keep the original quantitative image separate and inspect the exported result.
Can I recover scale from a screenshot?
Only if it includes a trustworthy reference that underwent the same scaling as the specimen image. A screenshot without reliable metadata or a valid reference does not establish physical dimensions. Ask for the original acquisition file instead of estimating from cell appearance.
Try a cell-view explanation in Animiotics
Use Animiotics to create a companion scene showing a camera moving toward a stationary cell nucleus, then returning to the wider view. Review the geometry and framing so the camera move does not imply cell growth. Signing up and the manual editor are free; AI generation and exports require a paid plan. Keep the calibrated micrograph and its scale bar as the experimental evidence.