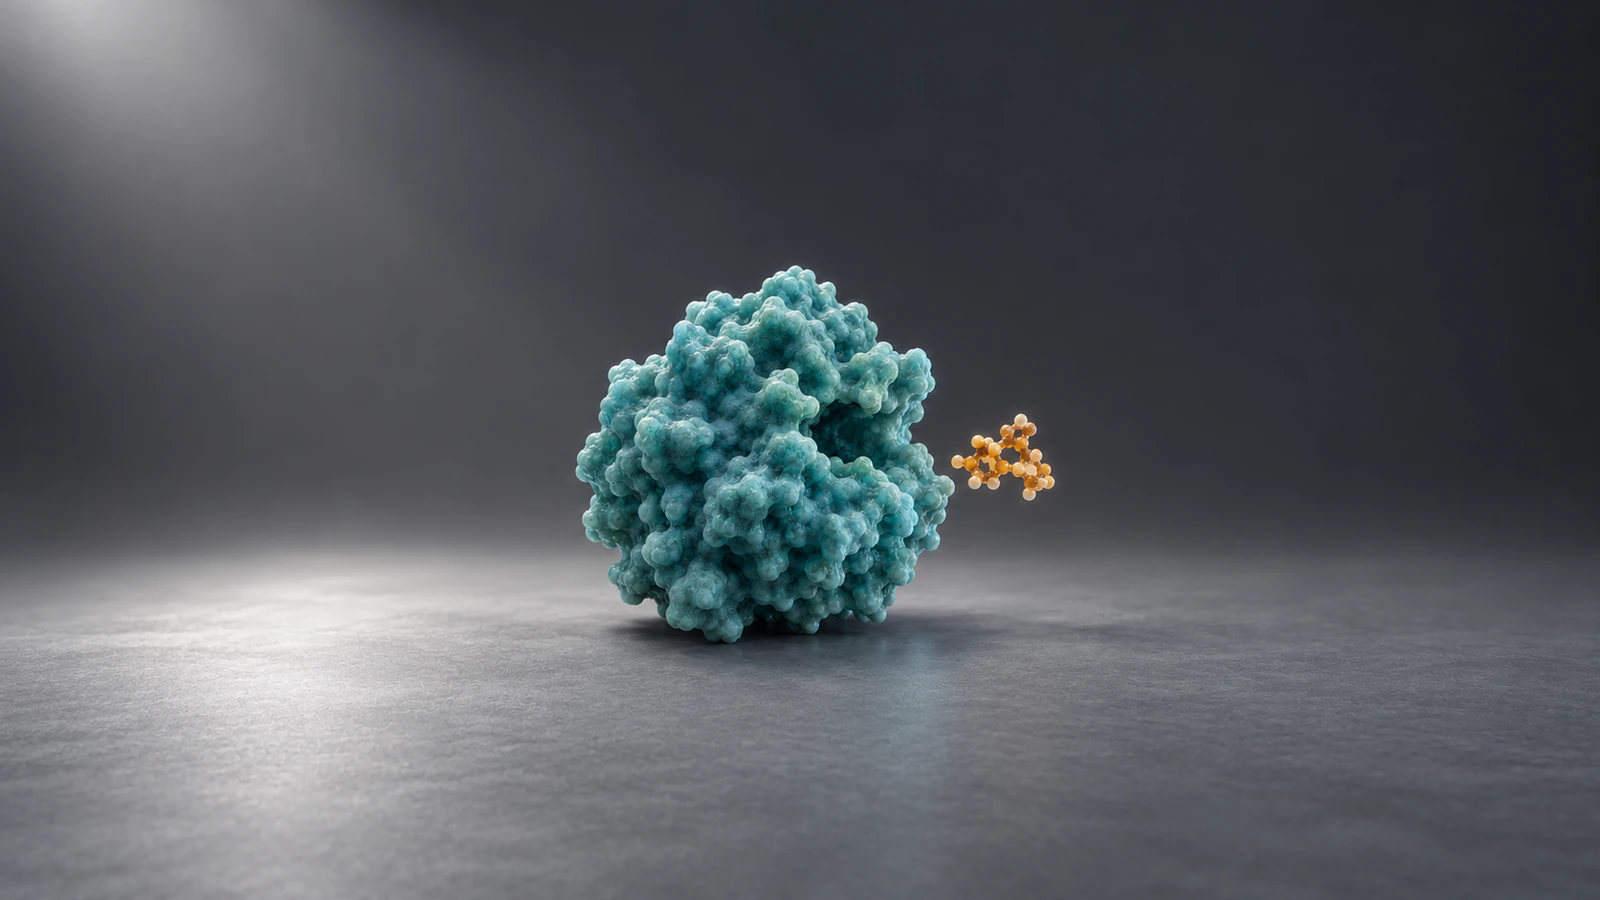
Give each panel an evidence status
A grant figure should let a reviewer distinguish what you measured, what you think explains it and what you plan to test. Give those roles separate panels with explicit headings: observed result, proposed mechanism and planned test with expected outcomes. Trace measured marks to a real source file, identify conceptual molecular views as illustrations and write predictions conditionally.
For an NIH application, place this figure in the Research Strategy or equivalent permitted attachment. The worked example below follows a hypothetical enzyme-inhibitor project. It provides a claim record, panel plan and caption you can adapt; it reports no actual experimental results.
Start with the question the figure must answer
Write one sentence before choosing artwork: Does compound X reduce the measured activity of enzyme E, and which experiment would test the proposed explanation? E and X are placeholders for this exercise. Replace them with your actual biological system only after checking its evidence.
A reviewer should be able to find the observation, the unresolved explanation and the next decision without following a dense pathway map. Remove any neighboring pathway that does not help that decision. A visually complete mechanism can still leave the important question unanswered.
NIH advice on application sections describes figures as a way to summarize data and clarify planned experiments. The three-panel arrangement here is an editorial method, not an NIH-mandated template.
Our broader NIH grant figures guide covers the surrounding visual argument. This exercise goes further into evidence status and a complete caption.
Build a claim record before drawing
Create a small working table for every visible assertion. Include the exact statement, its status, its source and what the image must avoid implying. This internal record can be a spreadsheet or a plain document; it is not another panel to squeeze into the application.
Separate an observation from its interpretation. A lower assay signal is an observation only if supported by the actual measurements. Direct occupancy of a specific pocket is a different assertion requiring appropriate evidence. Connecting the two with a smooth arrow does not establish that link.
| Proposed panel | Claim to document | Evidence needed | Boundary |
|---|---|---|---|
| A: observation | X changes the assay readout under stated conditions | Original assay files, analysis and controls | Do not infer a binding site |
| B: hypothesis | X may occupy a site on E | Relevant structural or mechanistic rationale | Show as proposed, not demonstrated |
| C: planned test | A follow-up assay will discriminate explanations | Protocol, comparison and decision rule | Do not draw an expected result as collected data |
| Caption | The evidence supports this limited conclusion | Panel-specific sources and limitations | Do not merge different biological contexts |
Work through the enzyme example
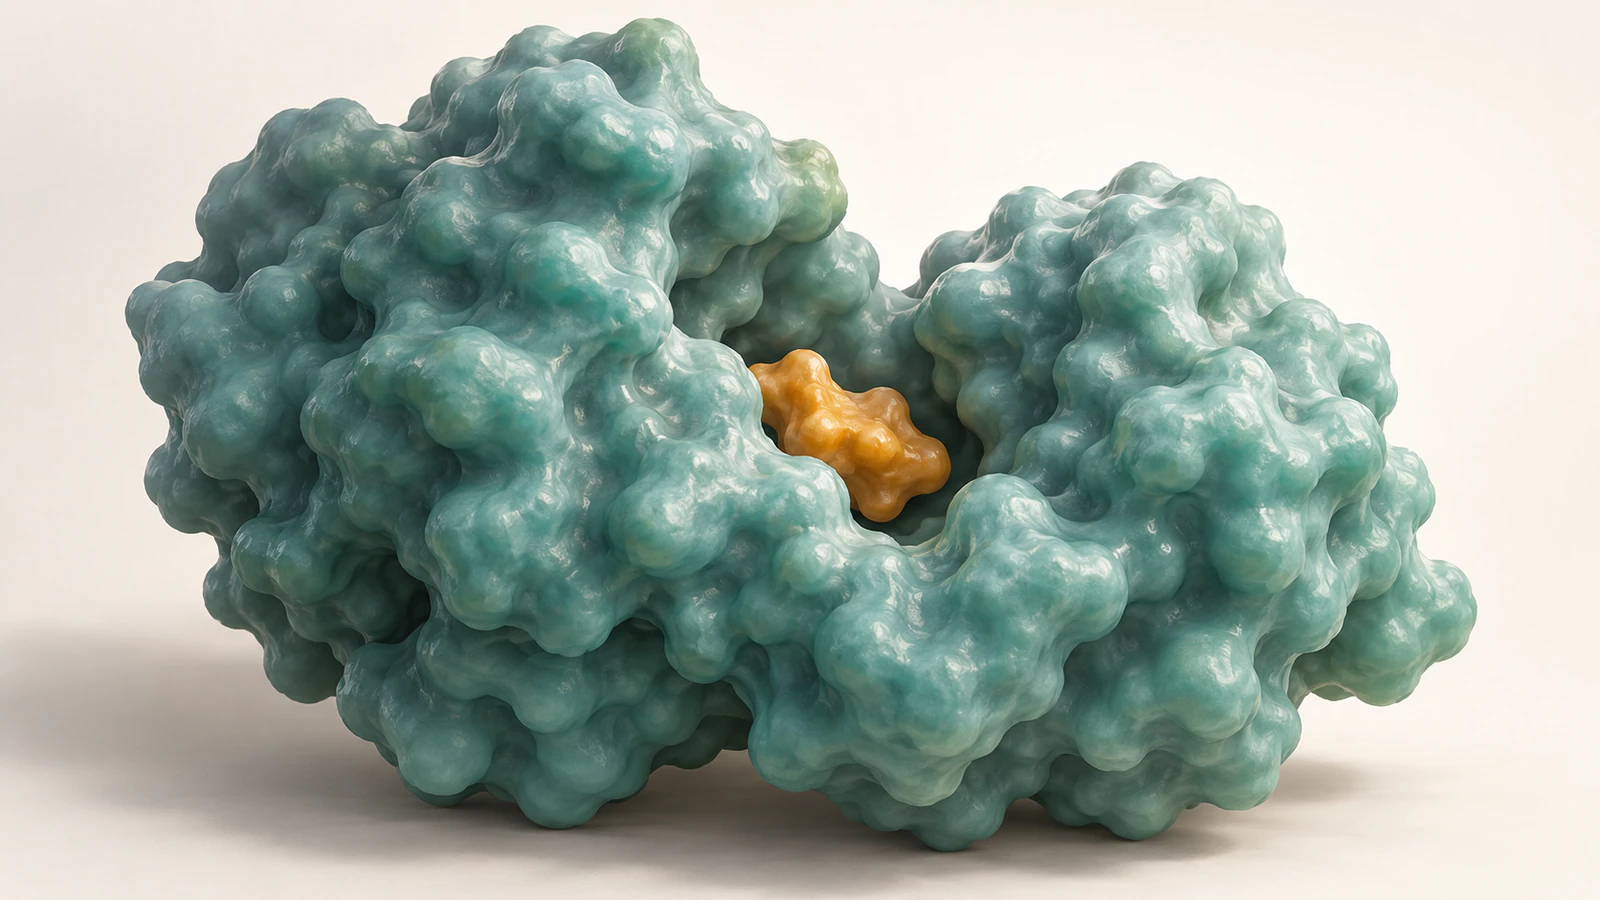
Suppose a team has preliminary measurements comparing enzyme activity with vehicle and compound X. Vehicle means the solvent condition used without X. The first task is to check what the readout measures, which samples belong together and whether the controls support its interpretation. No outcome is assumed here.
The team proposes that X occupies the enzyme's active site, the region involved in substrate binding and catalysis. A substrate is the molecule an enzyme acts on. OpenStax's enzyme chapter explains active sites and competitive inhibition, in which an inhibitor competes with substrate binding. That established concept does not identify X's mechanism.
Now separate three questions: Was the readout altered? Does the effect reflect enzyme activity rather than interference with detection? Does the evidence support the proposed binding location? Each question can require a different experiment. Keep that separation in the figure even when the proposed mechanism seems plausible.
This makes a useful grant figure because it shows both the rationale and the unresolved step. It avoids turning a preliminary activity observation into a claim about molecular contact.
Panel A: preserve the observation
Use your real analysis output for Panel A. State the measured variable, units, biological material and comparison. Explain the sample count and what counts as an independent replicate. Technical repeats from one preparation should not silently become independent biological samples.
Keep the source file and analysis version with the figure. If you normalize a readout, record the reference condition and transformation. If a control failed, decide whether the result remains interpretable before choosing a cleaner-looking subset. The illustration cannot resolve an analytical weakness.
NIH rigor guidance asks applicants to address strengths and weaknesses in prior research and describe transparent experimental design. For this figure, use that principle to write a precise statement of what the preliminary assay supports.
If the project has no preliminary measurements, omit the observed-result panel or replace it with clearly cited prior evidence. A proposed experiment can stand on its own. Never populate an empty data panel with invented points, representative-looking bands or decorative curves.
Panel B: label the mechanism as proposed
Use a restrained molecular view to show the explanation you intend to test. Place Proposed mechanism where a reader will encounter it immediately, then repeat the uncertainty in the caption. A dashed connection can help, but a line style alone is an unreliable substitute for words.
If you have an experimentally determined complex, identify the structure, chains and ligand and check how closely that system matches your project. If you have only a prediction or a conceptual model, say so. Different sources answer different questions.
RCSB's HIV-1 protease example demonstrates how specific deposited inhibitor complexes can support a structural explanation. It is an example of traceable structural evidence, not evidence for the hypothetical E and X used here.
Do not add residue contacts, atomic distances or a precise binding orientation to an illustration unless the source supports them. Keep those details out when their apparent precision would exceed your evidence.
Panel C: show the test and both branches
Panel C should make the next experiment understandable. Identify the comparison, the readout and the decision it can inform. In this example, a planned follow-up could compare activity across substrate and inhibitor conditions, with appropriate checks for interference in the detection method.
Describe the interpretation conditionally: If the results support the proposed competition model, we will pursue the binding-site hypothesis; if they do not, we will evaluate alternative explanations. Specify your actual design and analysis in the application. This diagram is not a complete kinetic protocol.
Give an informative unexpected outcome visible space. A null result, detection artifact or incompatible pattern can change the next step without erasing the project's question. Avoid a single glowing success endpoint that suggests the experiment has already worked.
Use workflow boxes or a compact decision diagram for the planned test. If you include an illustrative expected pattern, mark it as schematic and unmeasured. Often a written conditional result is clearer than a synthetic graph.
Write a caption that keeps the boundary visible
Draft the caption before the final artwork. Start with what the figure connects, then explain each panel's status and finish with the remaining uncertainty. Use the following structure with actual records in place of the bracketed fields.
Figure: Preliminary evidence and a testable mechanism for [system]. A, observed [readout] in [material and conditions], analyzed from [file or dataset reference]; [replicate definition, sample count, units and uncertainty display]. B, proposed [mechanism], shown conceptually or using [structure or model identifier]. C, planned [experiment] to evaluate [specific question], with [conditional interpretation and alternative branch]. Panel B does not establish [unmeasured interaction or location].
That is a writing template, not a completed scientific caption. Remove brackets only when you can supply the information. If a field is unavailable, revise the claim or gather the missing record.
Replace X blocks the active site with X reduced the measured readout under the tested conditions; active-site occupancy remains a hypothesis, if that is what your data support. The correction changes the claim, not just its tone.
Keep the static figure complete
A short animation can help a team inspect the proposed mechanism before composing a figure. Motion makes it easier to notice an unintended contact, a hidden object or a sequence that implies certainty. A still selected from that scene must still communicate its evidence status without playback.
Use the biology animation storyboard guide to plan the visual sequence. For this project, separate the enzyme-and-compound overview, the proposed interaction and the unresolved experimental question. Do not make the measured assay result part of a generated molecular scene.
Animiotics currently supports prompt-directed 3D scenes, editing and video or still rendering. Its homepage says joining is free and that generation and exports require a paid plan. Use a conceptual scene as illustration material; use your own analytical tools and source data for the result panel.
NIH's application guidance provides a separate route for permitted video material. A static Research Strategy figure should be understandable within the submitted document, with no reliance on an external animation link.
Check placement and the final PDF
Read the current NIH attachment-format instructions alongside your funding opportunity. At the time of writing, figures belong in the Research Strategy, Program Plan or equivalent attachment, count toward its page limit and should not appear in the Specific Aims attachment.
Inspect the final PDF at normal print size. Check that panel headings, units, symbols and uncertainty statements remain legible. A sharp full-screen image can become unreadable when reduced to its actual page width.
Ask a colleague to identify which panel contains collected data without reading the surrounding paragraph. If they cannot, revise the headings and caption. Then ask which experiment would change the proposed explanation. An answer that names only the desired outcome suggests the decision branch needs work.
- Every measured mark traces to a retained source and analysis.
- Observed, proposed and expected are stated in words.
- Structure identifiers and biological context match their claims.
- Controls, replicate definitions and uncertainty are explained where relevant.
- The future test includes an interpretable alternative outcome.
- The final application figure fits the permitted attachment and page limit.
FAQ
Can I show expected results in a grant figure?
Yes, when their status is clear and the relevant application instructions permit the figure. Mark predictions as expected or schematic and explain their conditions. Do not use a realistic synthetic graph that could be mistaken for preliminary measurements.
Does an enzyme-activity change prove direct binding?
An activity readout and a binding claim answer different questions. Check the assay's interpretation, controls and alternative explanations. Evidence for the proposed site or interaction must come from an appropriate experiment or clearly qualified model.
Do I need three panels for every project?
No. The arrangement is a practical method for a figure that connects preliminary evidence to a mechanism and a planned test. Use fewer panels when that makes the argument clearer, while keeping each claim's evidence status explicit.
Can a conceptual 3D image be used as preliminary data?
A conceptual render illustrates an explanation; it is not a measurement of the biological system. Label it accordingly and keep actual results connected to their source records, methods and analysis.
Can I put this NIH figure on the Specific Aims page?
Current NIH attachment guidance says figures should not be included in the Specific Aims attachment. Check the current instructions and your funding opportunity before submission and use the appropriate Research Strategy or equivalent attachment.
Try one proposed binding scene
Start with a small conceptual scene you can review with your team: an enzyme surface, a much smaller compound and a visible separation before any proposed contact. Keep a written note beside the scene stating which parts are supported and which are illustrative.
Suggested prompt, not a tested result: Create a conceptual enzyme-and-compound scene for discussing a proposed interaction. Keep the enzyme intact, show the compound separately before the proposed contact and use a stable camera. Do not add atom-specific contacts, residue labels or experimental readouts.
Review the result against the claim record before choosing a still or rendering an animation. Account creation is free; generation and exports require a paid plan under the current homepage terms.