Why Extracellular Vesicle Visualization Services Matter
Extracellular vesicle visualization services turn a difficult platform story into something buyers, investors, partners and reviewers can understand quickly. EV programs often combine cell source, vesicle biogenesis, cargo loading, surface engineering, purification, characterization, biodistribution and functional readouts. When those elements are described only with dense pathway diagrams or assay tables, the platform can feel abstract even when the underlying science is strong.
The communication challenge is specific: extracellular vesicles are small, dynamic and context dependent. A visual needs to show what the vesicle is, what it carries, how it reaches a target site and how activity is measured without implying unsupported precision. A polished render can make the particle recognizable. A short animation can show cargo transfer or tissue interaction. A figure system can connect characterization data to the therapeutic claim.
For Animiotics clients, the highest value usually comes from a reusable asset set rather than one isolated image. The same vesicle identity can appear in investor decks, BD packages, publication figures, conference graphics, website hero visuals and scientific review slides. That asset discipline is especially useful for platform companies that need to explain multiple cargo types or disease areas from one coherent visual language.
- Use EV visuals to connect particle identity with delivery value.
- Separate platform-wide biology from program-specific cargo claims.
- Build still figures and animation scenes from one consistent vesicle design.
Start With the EV Platform Story Map
A strong EV visualization project starts with a story map before any rendering begins. The team needs to decide whether the primary message is natural vesicle biology, engineered loading, targeting, tissue uptake, immune modulation, manufacturing control or translational evidence. Without that hierarchy, the final animation may look premium but still fail to answer the commercial question a viewer brings into the meeting.
A practical story map usually moves from source cell to vesicle identity, then from cargo to delivery context. The opening scenes can establish whether the platform uses exosomes, microvesicles or a defined extracellular vesicle population. Later scenes can show RNA, protein, small molecule or editing cargo, then move into uptake, endosomal release, receptor engagement or paracrine signaling depending on the actual claim.
This approach makes extracellular vesicle visualization services commercially useful. A partner diligence deck may need a source-to-vesicle sequence and a cargo delivery still. A website may need a clean hero render and a short loop. A conference presentation may need a deeper mechanism sequence that compares EV delivery with other modalities such as siRNA therapeutic mechanism of action animation or AAV gene therapy vector animation.
- Define the one claim each visual scene should support.
- Keep the vesicle design recognizable across deck, web and animation uses.
- Avoid forcing source, cargo, delivery and assay data into one crowded frame.
Make Vesicle Identity and Cargo Easy to Read
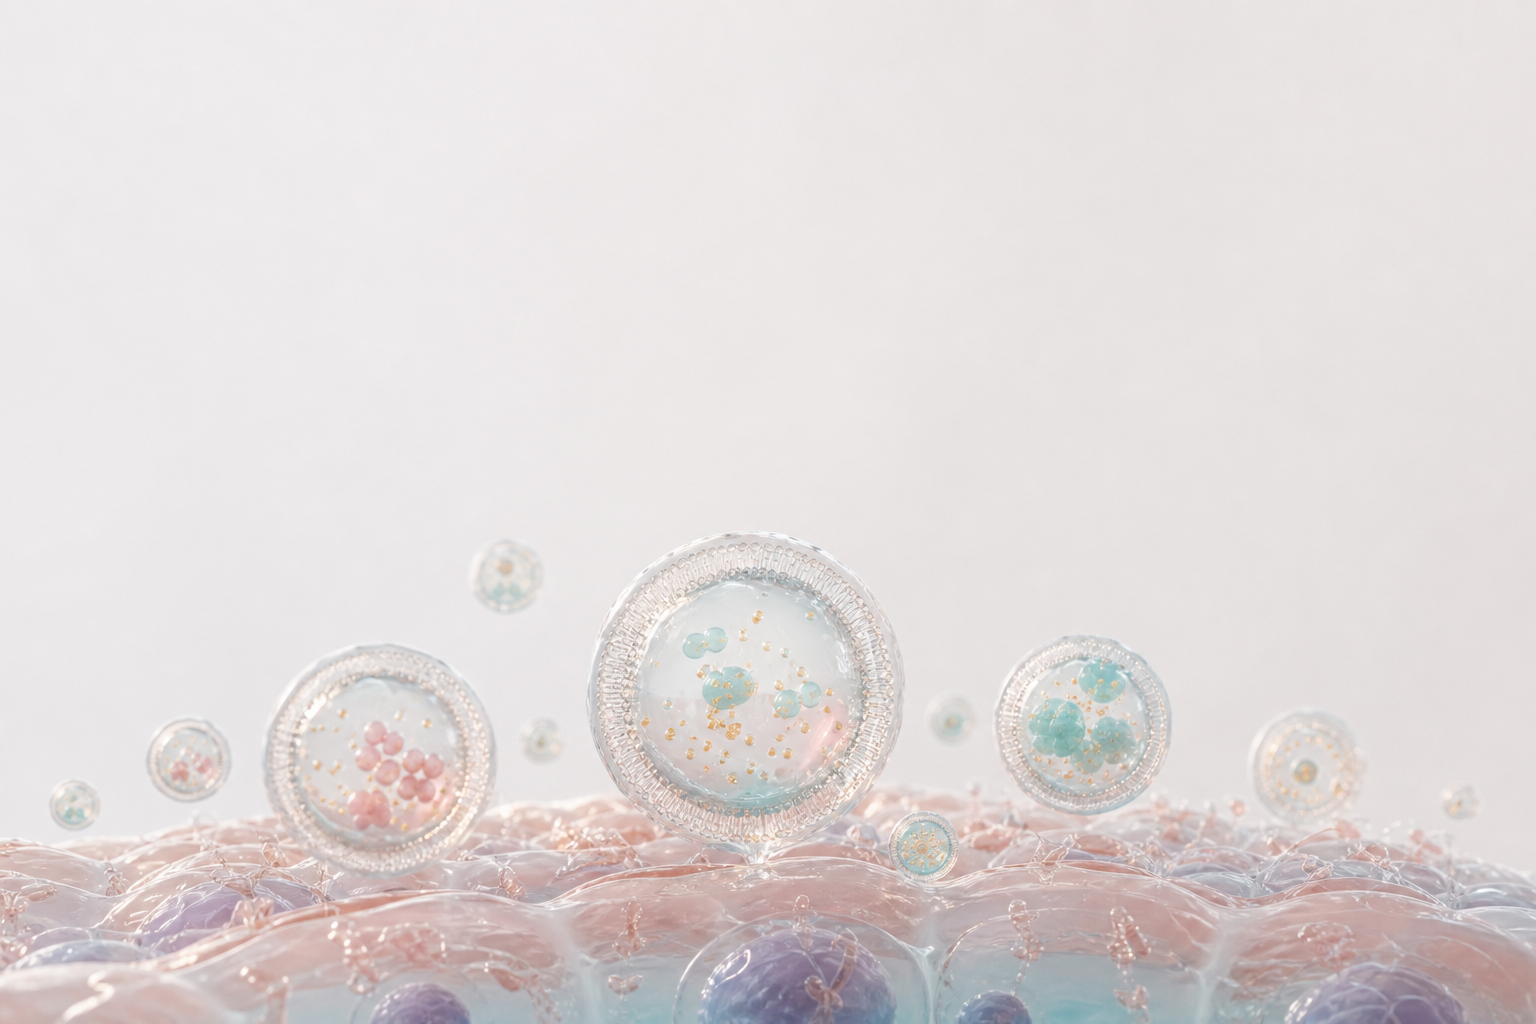
EV platform visualization needs a clear particle identity. A viewer should quickly understand that the subject is a membrane-bound vesicle rather than a generic nanoparticle or decorative bubble. That usually means showing a soft lipid membrane, a modest surface texture, internal cargo and scale relationships that feel biomolecular without becoming noisy.
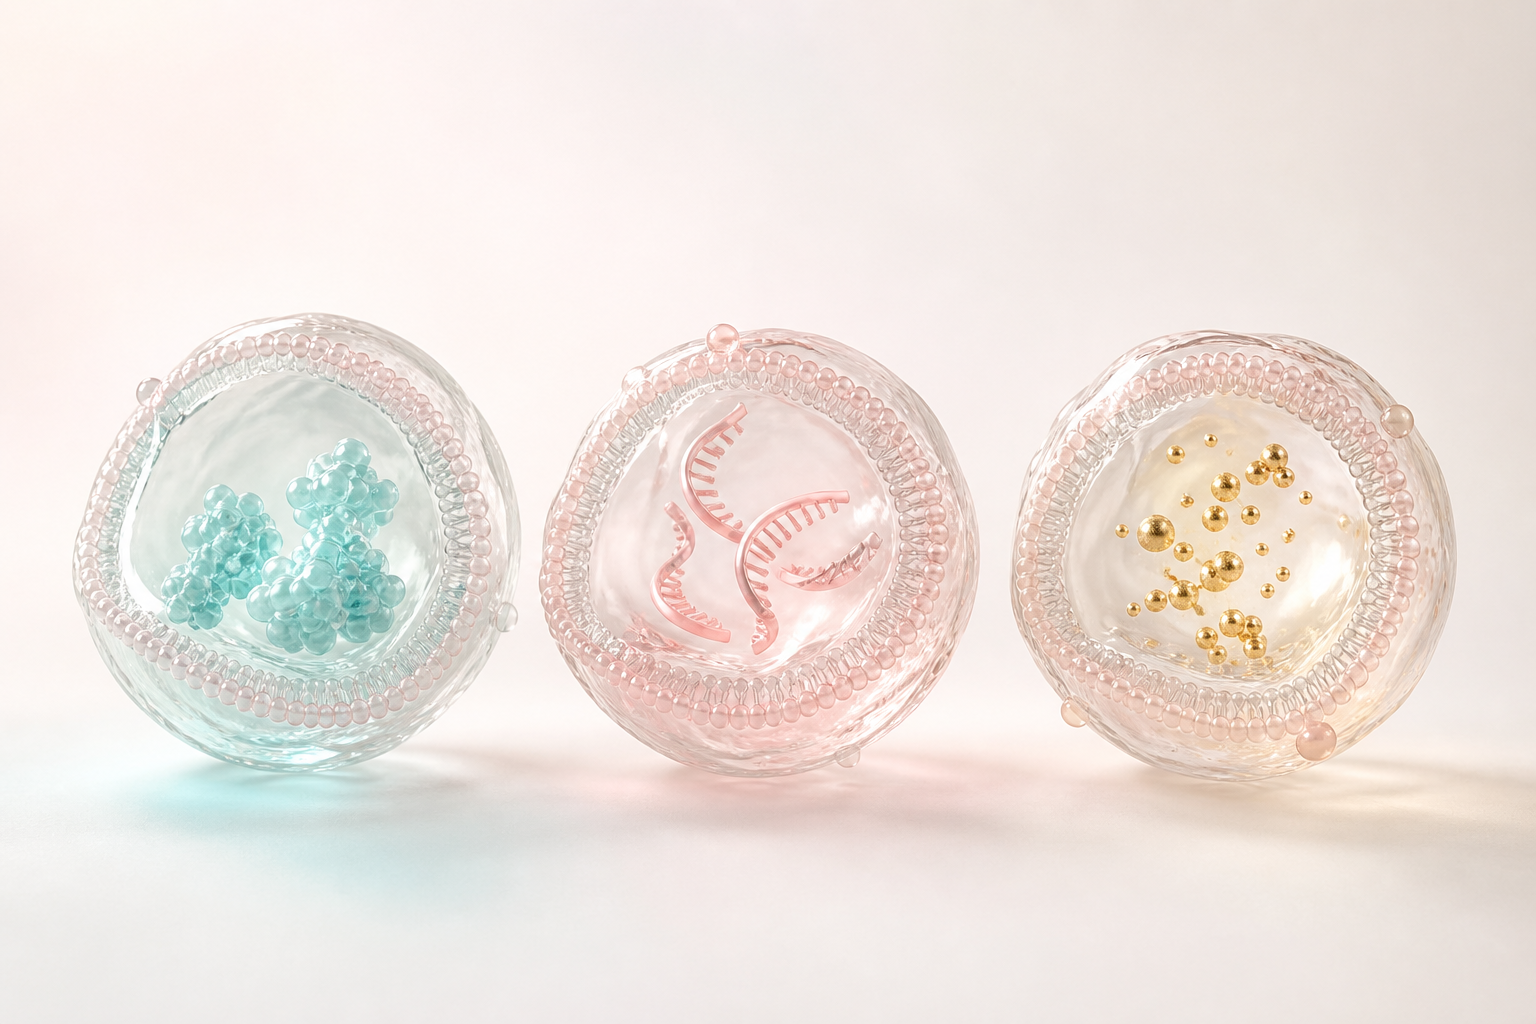
Cargo should be simplified according to the audience and evidence. RNA can be shown as a clean ribbon or strand, protein cargo as organized clusters and small molecule cargo as small luminous particles. Surface engineering can be represented with restrained membrane features when it is central to the claim. The goal is to explain the design logic, not to draw every lipid or marker.
Consistency matters because many EV companies need to compare cargo classes or disease programs. If one image uses a glassy aqua vesicle and another uses a saturated collage style, the platform feels fragmented. A controlled 3D material system lets the same vesicle appear with different cargo while still reading as one technology.
- Give each vesicle a stable membrane language and scale cue.
- Show cargo only when it supports a scientific or commercial claim.
- Use color to separate cargo class rather than decorate the image.
Show Engineering Manufacturing and Characterization Without Clutter
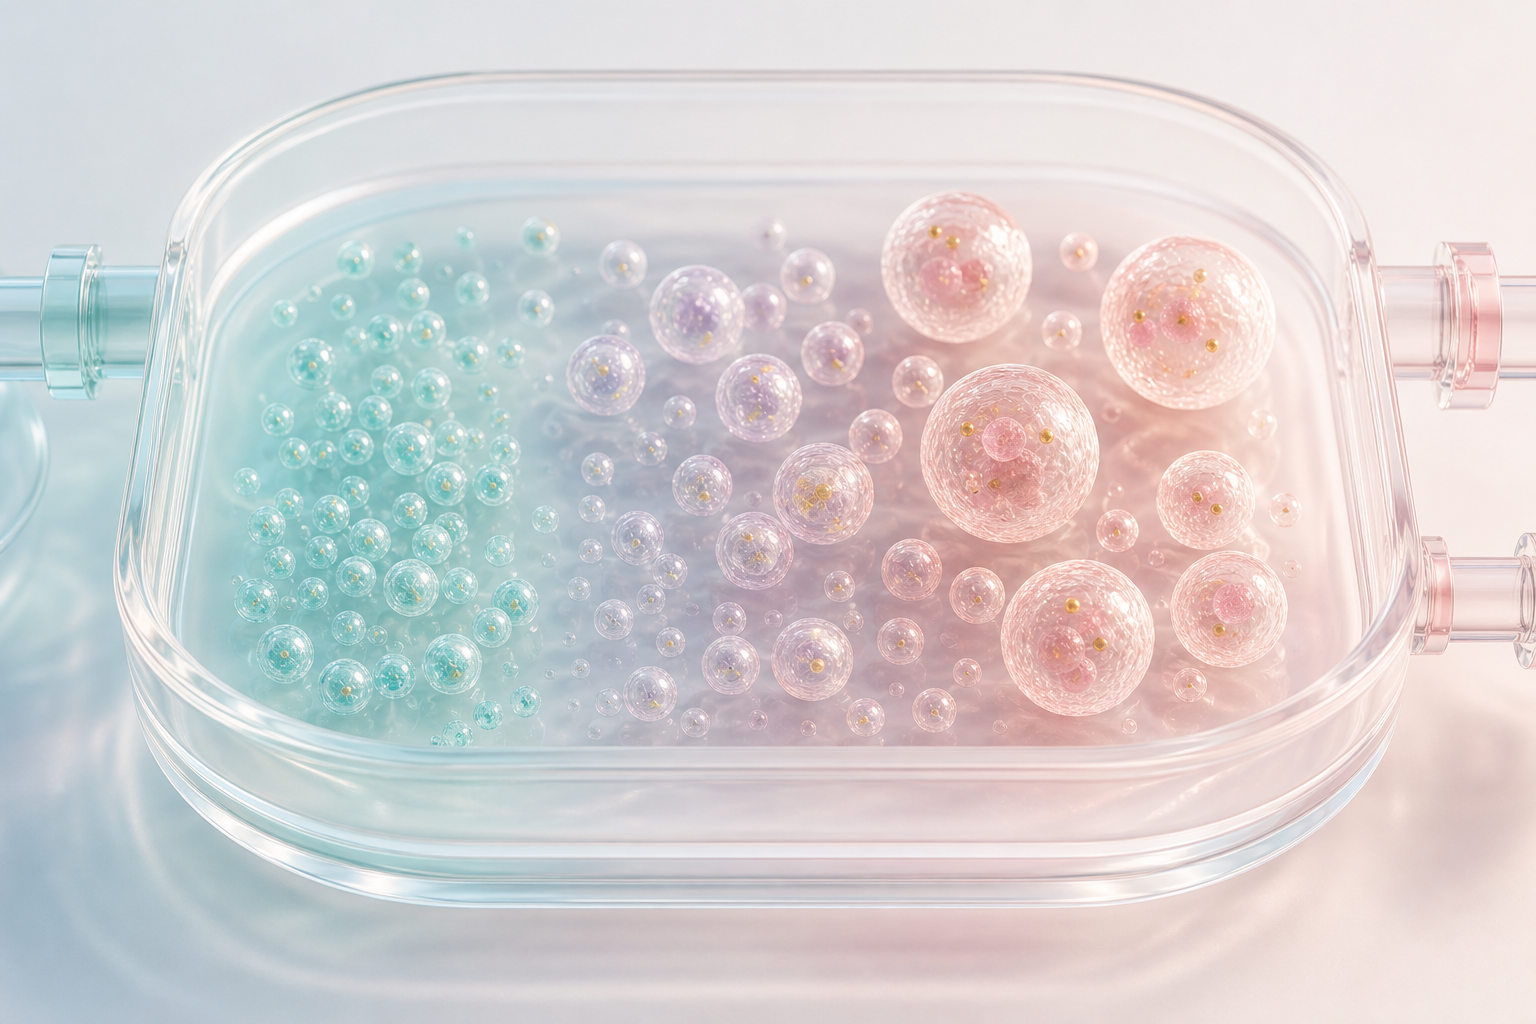
Manufacturing and characterization are central to EV credibility, yet they can become visually heavy fast. A good figure does not need to show every unit operation. It needs to make control visible: source material, vesicle collection, purification, size distribution, identity markers, potency assays and release criteria. Those checkpoints help a platform feel reproducible rather than speculative.
A 3D render can show a clean culture or purification environment with organized vesicle populations, while a companion figure can summarize the assays that matter. Particle size, cargo loading, purity, potency and stability can be represented as controlled visual states instead of generic lab icons. The result is more useful for a scientific buyer than a decorative lab scene.
This is similar to the logic behind translational biomarker visualization services. The audience needs to see how evidence supports decisions. For EV platforms, that means connecting particle characterization to delivery, functional response and product consistency.
- Use manufacturing visuals to show control rather than equipment inventory.
- Connect characterization readouts to the claims they support.
- Separate process visuals from mechanism scenes so each asset has one job.
Explain Biodistribution Targeting and Tissue Uptake
Extracellular vesicle biodistribution is a frequent source of buyer questions. Where do the vesicles go, what tissue compartment do they enter and what evidence supports that claim? A clear visualization can show circulation, local delivery or tissue penetration while keeping uncertainty visible. The image should not imply precise targeting if the program has not generated that evidence.
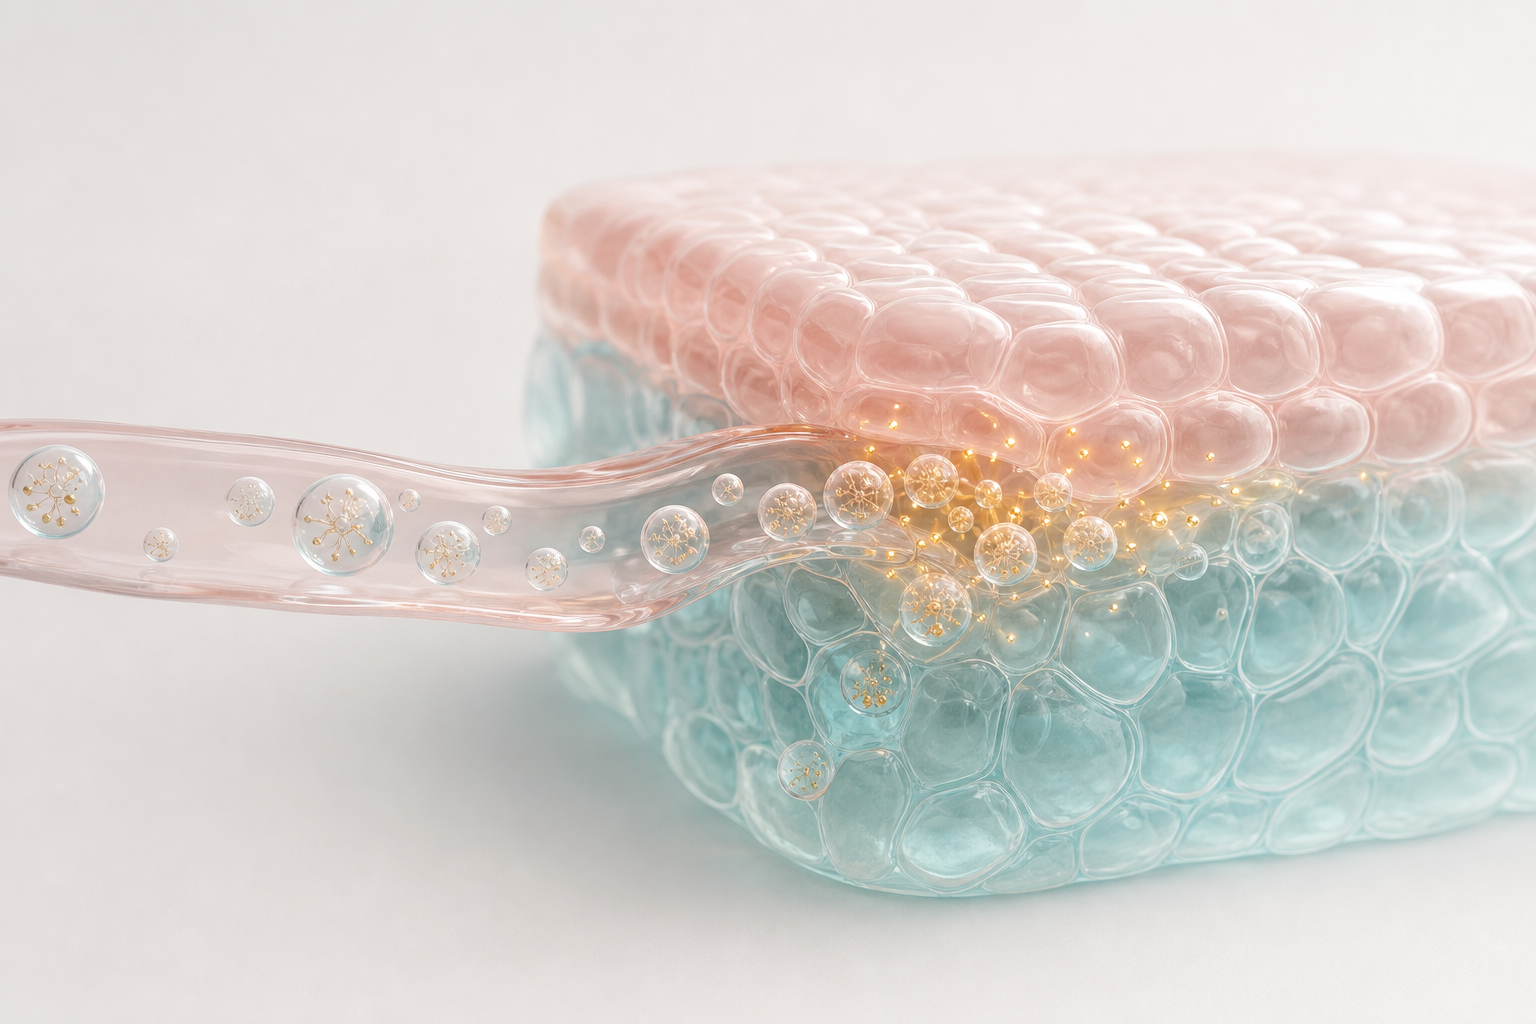
For tissue scenes, simplified translucent environments work better than full anatomical complexity. A soft tissue block, vascular path or cellular boundary can orient the viewer while keeping vesicles readable. The animation can then show approach, contact, uptake or local signaling depending on the mechanism. This makes the delivery story easier to evaluate than a static schematic packed with arrows.
EV visuals can also connect to broader platform storytelling. If the company is positioning EVs against viral vectors, lipid nanoparticles or cell-derived therapies, the visual system can compare route, cargo state, tissue context and response readout without overstating superiority. The point is to make the platform claims inspectable.
- Show route and tissue context before showing cargo activity.
- Keep vesicles visible at cell scale before zooming out to clinical meaning.
- Distinguish observed biodistribution evidence from planned mechanism.
Turn EV Evidence Into Investor and Partner Assets
Investors and partners need EV visuals that bridge biology, evidence and product value. A mechanism render explains what the vesicle carries. A biodistribution scene explains where the vesicle needs to act. A characterization figure explains how the product is measured. Together, those assets make the platform easier to discuss in fundraising, diligence and collaboration meetings.
The best commercial visuals do not hide complexity. They organize it. A partner should be able to see which claims are supported by in vitro potency, which are supported by biodistribution data and which remain program risk. This is exactly where a polished figure system improves the conversation: each asset narrows one scientific claim and makes the evidence easier to inspect.
That workflow aligns with biotech investor deck scientific visualization. A platform deck should not depend on a single master diagram. It should use a small sequence of reusable visuals that clarify technology, differentiation, proof points and next milestones.
- Use one visual per claim instead of one overloaded platform diagram.
- Pair mechanism scenes with characterization and potency evidence.
- Create short meeting assets plus deeper scientific review versions.
Storyboard Extracellular Vesicle Figures and Animation
A storyboard keeps extracellular vesicle visualization services focused on decision-making rather than decoration. Each scene should have a biological purpose, a business use and a defined scientific boundary. That structure also makes review faster because scientists can approve the intended claim before rendering detail increases.
The table below is a practical starting point for biotech teams planning EV figures, 3D renders or a short exosome mechanism animation.
| Scene | Visual focus | Motion or change | Business purpose |
|---|---|---|---|
| Source and vesicle identity | Defined source cell or vesicle population with restrained membrane detail | Vesicles emerge or resolve into a clean product view | Show what the platform produces |
| Cargo loading | RNA, protein or small molecule cargo inside a consistent vesicle shell | Cargo becomes visible inside the particle | Explain design logic and payload differentiation |
| Characterization | Size, purity, marker and potency states as clean visual summaries | Vesicle populations become organized by quality state | Build confidence in product control |
| Tissue arrival | Translucent tissue context with vesicle movement into a target region | Vesicles travel, accumulate or contact relevant cells | Explain biodistribution or local delivery assumptions |
| Functional response | Cargo release, receptor engagement or paracrine signaling | Target cell state changes in a restrained way | Link mechanism to evidence and therapeutic value |
FAQ About Extracellular Vesicle Visualization Services
What should extracellular vesicle visualization services include?
AA useful project should include vesicle identity, cargo strategy, source or engineering logic, manufacturing context, characterization evidence, biodistribution and the functional response that supports the platform claim.
How long should an exosome animation be?
AMany commercial uses work well as a 45 to 90 second mechanism sequence plus still renders for decks and websites. Scientific conferences or partner diligence packages may need a longer narrated version with clearer evidence boundaries.
Can the same EV asset set support multiple cargo types?
AYes. A planned visual system can keep the vesicle membrane, lighting and scale consistent while changing internal cargo for RNA, protein, small molecule or gene editing payload stories.
How detailed should vesicle membranes and surface markers be?
ADetail should match the claim and available evidence. If a marker or targeting ligand is central, show it clearly. If it is not central, simplified membrane detail is usually more readable and less likely to overstate precision.
CTA: Plan EV Visuals With Animiotics
Animiotics helps biotech, platform and research teams turn extracellular vesicle biology into clear scientific figures, polished 3D renders and mechanism animation assets. The best starting point is a focused visual plan that covers vesicle identity, cargo, manufacturing control, tissue context and translational evidence.
If your team is preparing an investor deck, partner package, conference visual system, manuscript figure set or launch page, Animiotics can help translate the platform into a coherent asset set that looks premium without losing scientific credibility.
Open this template in Animiotics
- Use this workflow when EV cargo, targeting or characterization needs to be explained clearly.
- Bring platform claims, assay evidence and intended use cases into the first visual planning pass.