Explain the apparent contradiction
Competitive inhibition lowers the reaction rate at a given substrate concentration, yet the ideal reversible model has the same limiting rate, Vmax, as the uninhibited reaction. To animate that distinction, hold enzyme amount and inhibitor concentration fixed, compare several substrate concentrations and show reversible binding. Increasing substrate must not turn the enzyme into a faster machine. The lesson is that both rate curves approach the same limit while the inhibited curve needs more substrate to reach a given rate.
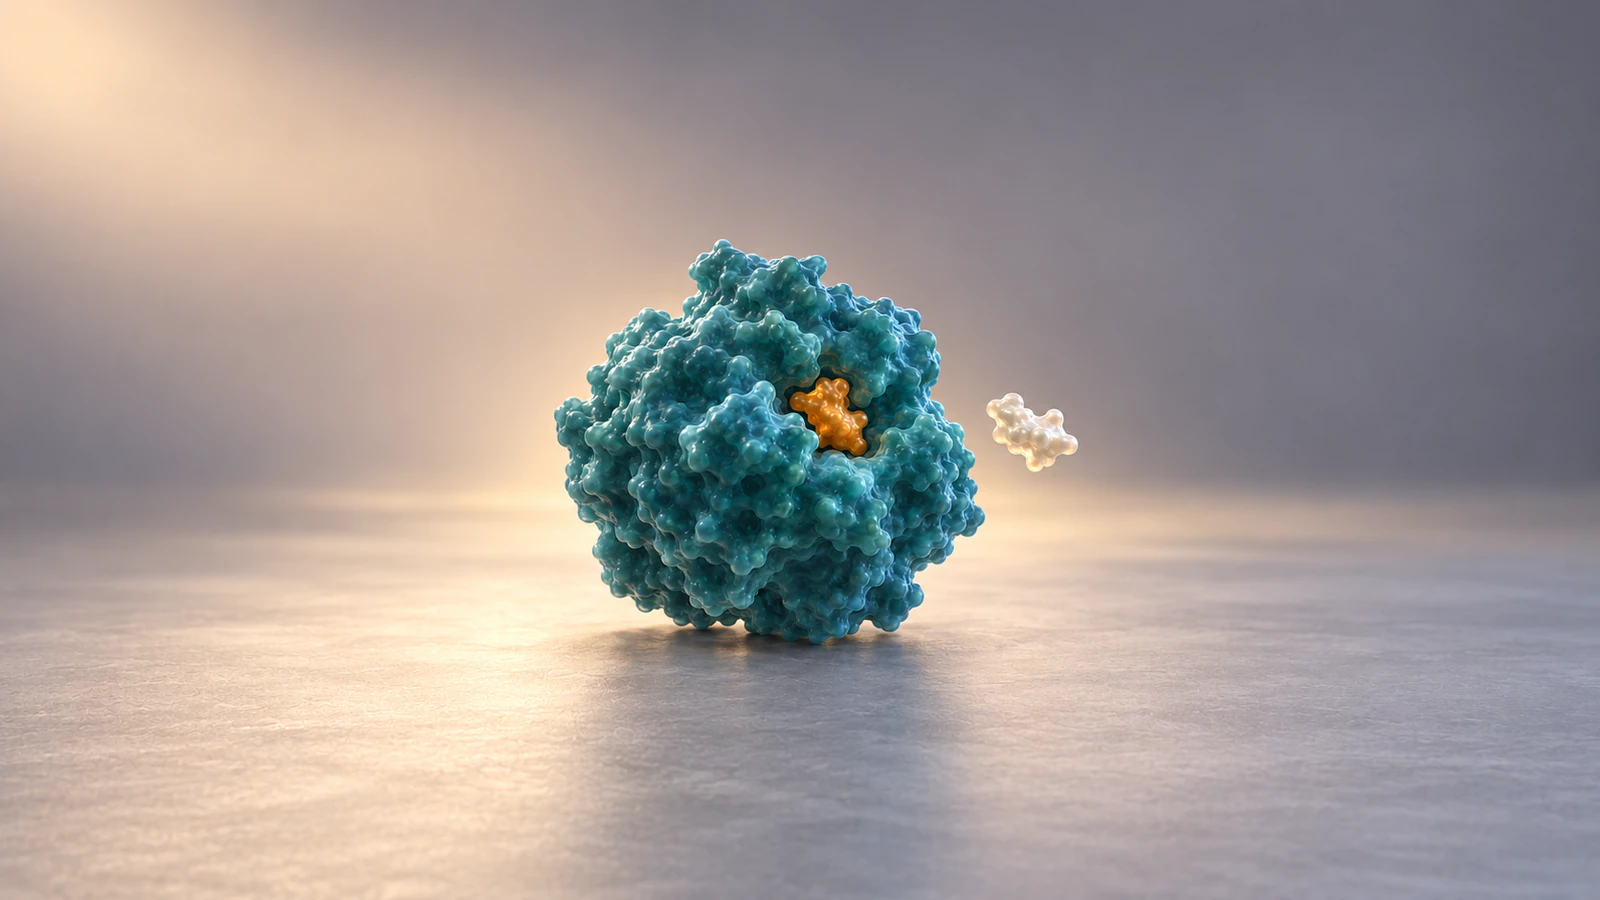
This guide provides a numerical classroom example and a six-shot scene plan for Animiotics. The calculations are checked; the proposed animation brief has not been executed or validated as a molecular simulation. All four illustrations use invented molecular envelopes.
The earlier guide to enzyme inhibition animation explains how to distinguish binding geometry from kinetic classification. Here, the narrower task is to make the unchanged-limit argument understandable without suggesting that inhibition disappears at every higher substrate concentration.
Choose the model before the molecules
Use a simple, reversible, single-substrate competitive model for this exercise. A substrate is the molecule an enzyme acts on; an inhibitor reduces activity under the stated conditions. In the selected model, substrate and inhibitor binding are mutually exclusive. The Assay Guidance Manual explains that this does not always require both molecules to occupy exactly the same physical site.
A shared-pocket illustration is convenient, but label it as the example you chose. Do not generalize its invented geometry to a named enzyme or drug. Nor should a remote binding location automatically acquire a noncompetitive label: the observed kinetic pattern requires its own evidence.
Keep the exercise within its assumptions. Use initial-rate conditions with approximately stable free substrate and inhibitor concentrations, constant enzyme amount and unchanged environmental conditions. Tight binding, time dependence and more complex mechanisms need separate treatment. The manual discusses these complications; this lesson deliberately does not model them.
Define the two quantities viewers confuse
Vmax is the limiting reaction rate at high substrate concentration under the chosen conditions. Km is the substrate concentration giving half that limiting rate for Michaelis-Menten kinetics. The IUBMB terminology recommendations emphasize that Km is not generally an equilibrium binding constant. Avoid narrating every increase in apparent Km as a physical weakening of the substrate-binding pocket.
The word apparent matters. With inhibitor present, the substrate-rate relationship has a larger apparent Km while retaining the same Vmax in this model. You have changed the measured relationship under those conditions, not demonstrated a new protein structure.
Also distinguish a limit from a reachable finish line. A finite substrate concentration need not give exactly Vmax. An animation that ends at a particular high concentration should report its calculated rate, rather than announce that the maximum has already been reached.
Calculate a small substrate series
Choose illustrative inputs: Vmax = 100 arbitrary activity units, Km = 10 micromolar, inhibitor concentration [I] = 5 micromolar and inhibition constant Ki = 5 micromolar. These are invented teaching values, not measurements of a biological system. Ki and [I] use the same concentration units.
The GraphPad competitive-inhibition equation gives apparent Km = Km × (1 + [I]/Ki), so this example has apparent Km = 20 micromolar. Calculate the initial rate as v = Vmax × [S] / (apparent Km + [S]), where [S] is substrate concentration. For the no-inhibitor column, use Km = 10 instead.
The values below were independently calculated in JavaScript and rounded to two decimal places. Keep the unrounded values in your teaching notes. The rate unit is intentionally arbitrary; do not relabel these numbers as molecules per second or micromoles per minute.
| Substrate, micromolar | Rate without inhibitor | Rate with inhibitor |
|---|---|---|
| 5 | 33.33 | 20.00 |
| 10 | 50.00 | 33.33 |
| 20 | 66.67 | 50.00 |
| 100 | 90.91 | 83.33 |
| 1000 | 99.01 | 98.04 |
Ask for a prediction before revealing rates
Begin with the 10-micromolar row. Ask learners whether adding inhibitor changes the rate at that same substrate concentration. Reveal 50.00 without inhibitor and 33.33 with inhibitor. Then ask what substrate concentration the inhibited example needs to reach a rate of 50.00. The answer is 20 micromolar, its apparent Km.
This equal-rate comparison is useful because it holds the outcome constant while changing the required substrate concentration. It is easier to inspect than a rapid montage of differently crowded molecular scenes. Display the numbers in the lecture slide or accompanying worksheet, where their units and assumptions can remain visible.
Finally, compare the 1000-micromolar values. Both approach 100 but neither equals it, and the inhibited rate remains lower. Ask students to explain how that can coexist with an unchanged Vmax. A satisfactory answer separates the finite-concentration rate from the limiting value instead of saying that more substrate simply removes every inhibitor.
Write the permitted binding sequence
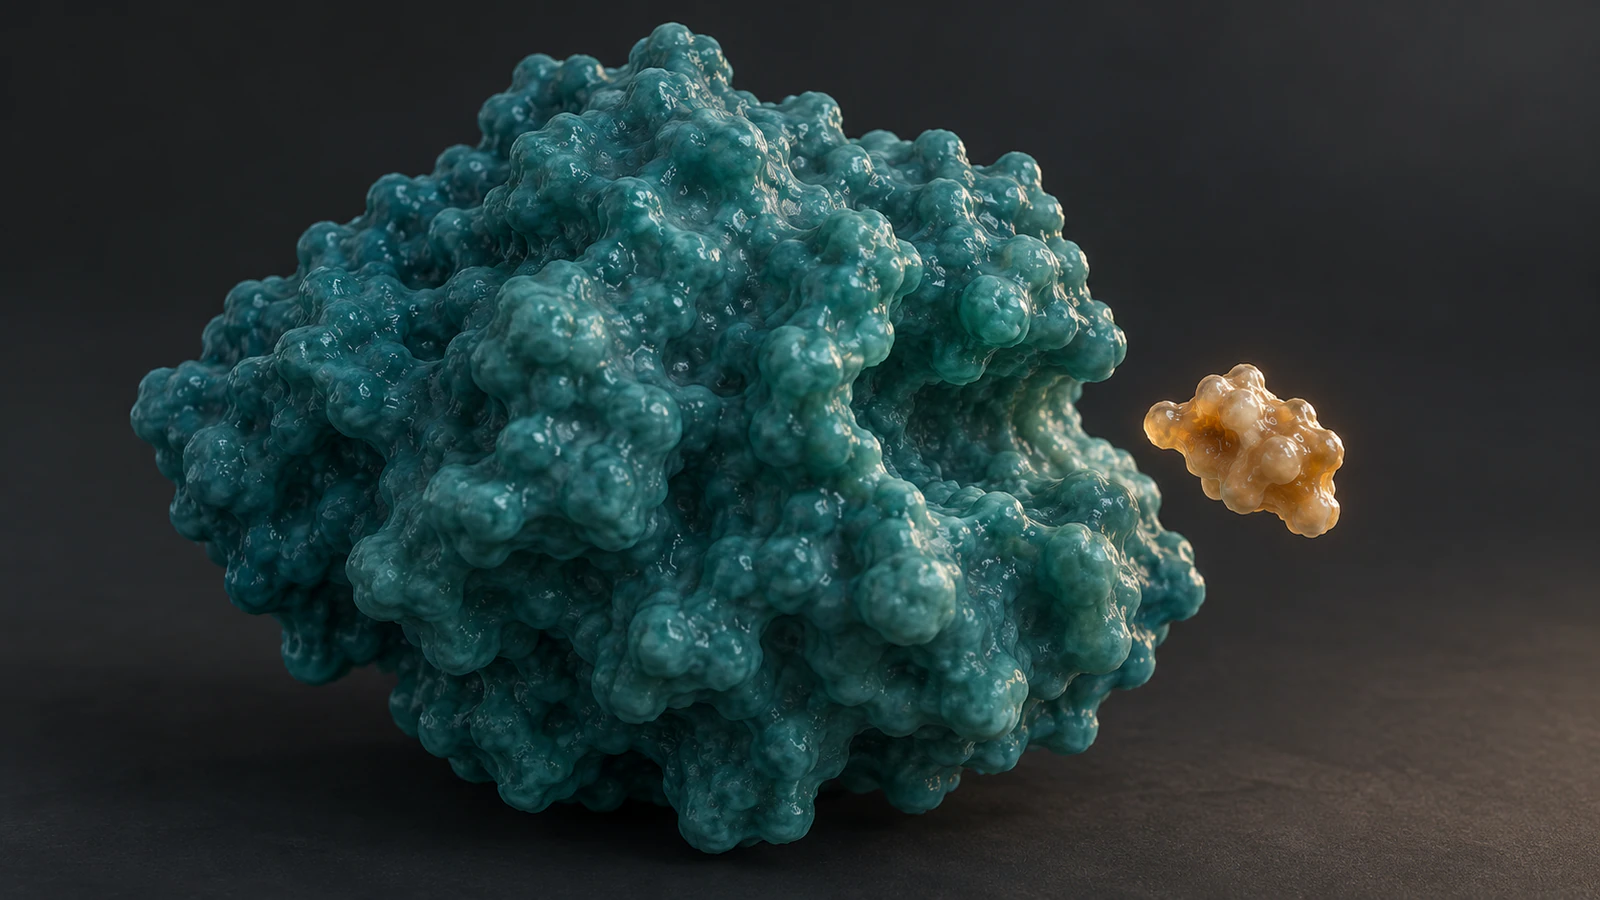
Give the scene three permitted enzyme states: empty, substrate-bound and inhibitor-bound. In this simplified same-pocket model, do not show substrate and inhibitor bound to one enzyme simultaneously. Keep a written state list beside the brief so that attractive intermediate frames cannot quietly introduce a different mechanism.
For one selected event, show an inhibitor-bound enzyme, then the inhibitor leaving, then an empty pocket and finally substrate binding. Leave a visible gap during the empty state. The substrate must not ram the inhibitor, pull it out or pass through it. This is a schematic sequence of allowed events, not a measured trajectory or a claim that every release is followed by substrate capture.
Set viewing time for comprehension and say that it is illustrative. A two-second hold does not mean a two-second residence time. The separate guide to simulation time and movie playback explains why screen timing and physical time require different records.
Build a six-shot classroom sequence
Use the following sequence as a reproducible editorial plan. The suggested durations are presentation choices, not kinetic parameters. Keep the same camera orientation across the three concentration examples, and make each change of condition explicit in narration or the accompanying slide.
A fixed comparison window helps the viewer notice the one variable you changed. Do not accelerate particle motion in the high-substrate shot or add enzymes to make the scene look more active. If the population view becomes crowded, simplify it and leave the numerical comparison in the worksheet.
| Shot | Suggested duration | Visible event and teaching purpose |
|---|---|---|
| 1. Establish | 4 seconds | Identify one enzyme, pearl substrate and amber inhibitor; state the conceptual model. |
| 2. Baseline | 5 seconds | Show substrate binding to an empty enzyme; introduce the no-inhibitor condition. |
| 3. Inhibited condition | 5 seconds | Show one inhibitor-bound enzyme and separate substrate; ask for the rate prediction. |
| 4. Release | 5 seconds | Show inhibitor leaving before substrate binds; preserve the empty intermediate state. |
| 5. More substrate | 6 seconds | Show a wider population with more substrate, unchanged enzyme amount and unchanged inhibitor condition. |
| 6. Compare | 5 seconds | Return to a stable overview while the accompanying table explains the shared limiting rate. |
Give Animiotics a reviewable brief
The current Animiotics workflow starts from a written description and supports follow-up revisions to an editable 3D scene. Use the brief below to request a conceptual explanation. It does not ask the product to solve enzyme kinetics, reproduce a measured molecular path or infer a real binding pocket.
Suggested prompt: Create a short classroom animation of a generic reversible competitive inhibitor. Use one muted teal enzyme envelope with a shallow cleft, a small pearl substrate and a small amber inhibitor. Treat the shared pocket as a conceptual example. Show the inhibitor bound, then leaving, then a visibly empty pocket, then substrate binding. Never show substrate and inhibitor bound together. Keep the enzyme intact and avoid collisions that eject the inhibitor.
Follow-up brief: Add a wider comparison with more substrate while keeping the enzyme amount and inhibitor condition unchanged. Keep motion speed and camera orientation comparable. Particle counts, geometry and timing are illustrative. End with a clear, still overview so the teacher can explain the accompanying numerical table.
Inspect the generated states before polishing materials. If a ligand intersects the protein or a transition skips the empty pocket, ask for that specific correction. The proposed brief remains untested here; scientific review is required for the finished scene.
Check what the population view implies
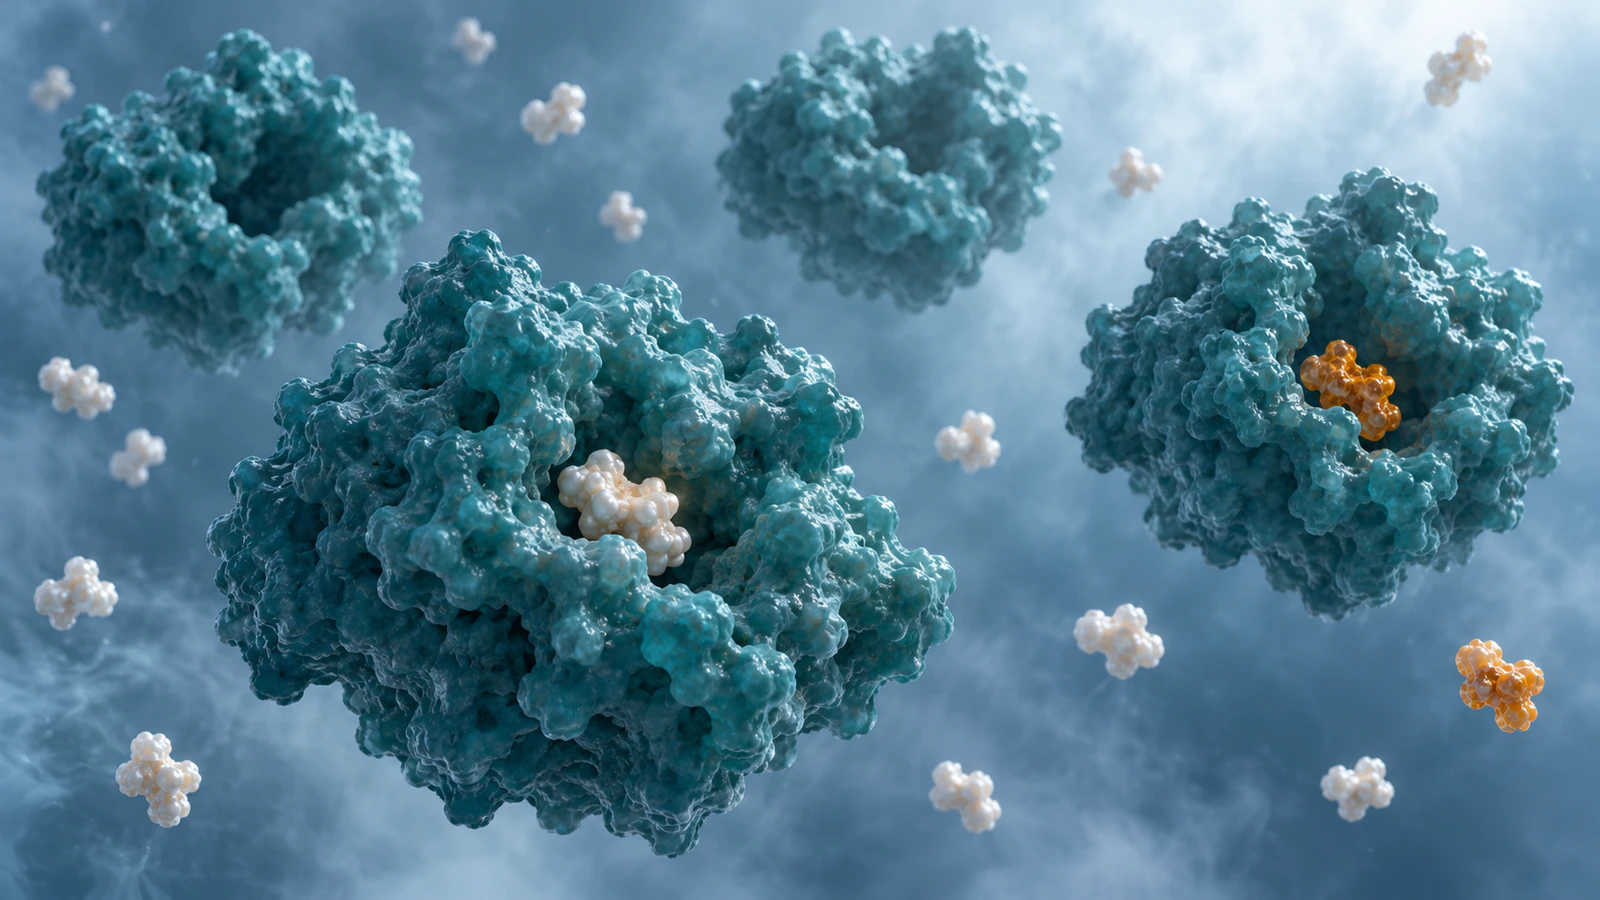
A small rendered population cannot by itself establish a bulk concentration. In this exercise, additional pearl shapes are a qualitative cue only. Keep the inhibitor condition fixed in the accompanying description, but do not force every frame to contain the same number of bound inhibitors. Condition and instantaneous occupancy are different concepts.
Do not convert a rate such as 33.33 into exactly one-third of the visible enzymes being occupied by substrate unless you have explicitly derived that mapping for a defined model. The rate table reports the chosen kinetic equation. It does not specify all binding probabilities, collision frequencies or molecular trajectories.
Use a caption that travels with the animation: Conceptual reversible competitive-inhibition example. Molecular geometry, particle counts and playback timing are illustrative. Accompanying rates were calculated from stated teaching parameters; they are not experimental measurements. This keeps the visual useful when someone later reuses a still without the original narration.
Fix the failure before adding detail
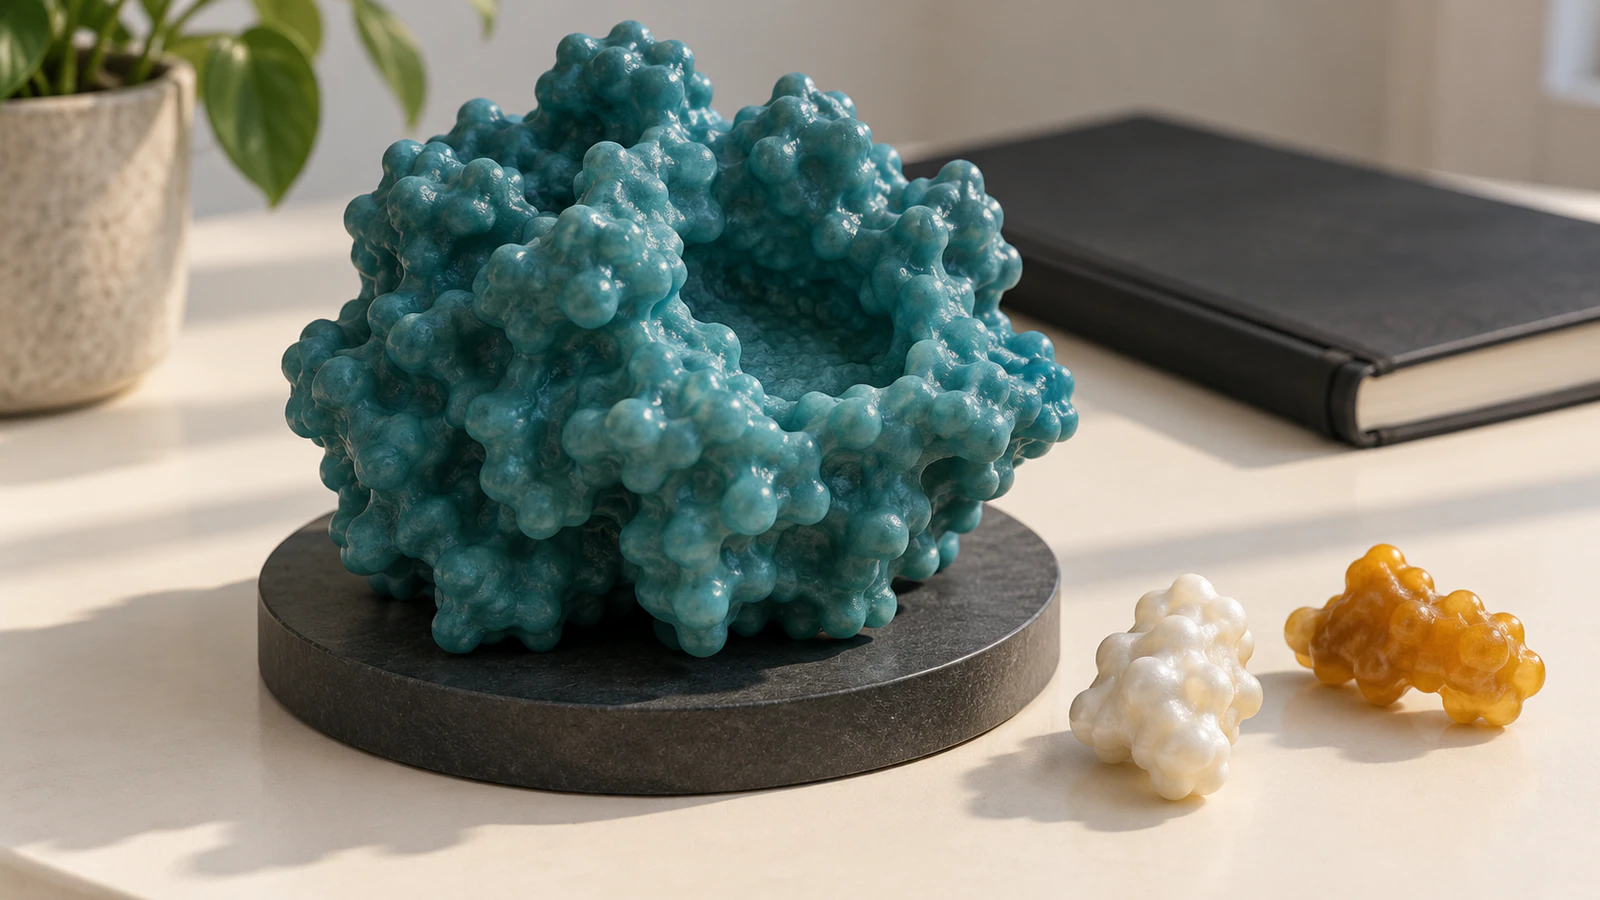
Review the scene once with the numerical table visible and once with the sound muted. The first pass checks the explanation; the second checks whether the molecular identities and state changes can be followed without narration repairing an ambiguous image. Ask a colleague to identify the inhibitor in every shot.
Keep the final review record short: selected model, parameter table, calculation version, allowed states, illustrative timing and unresolved limitations. If you replace the generic enzyme with a named structure, add its organism, assembly and ligand identity. A new molecular asset needs a new scientific check even when the storyboard stays the same.
| Problem in the draft | Specific correction |
|---|---|
| The inhibitor never leaves | Include reversible release before the next selected substrate-binding event. |
| Substrate pushes inhibitor away | Separate release and capture with a visible empty-pocket state. |
| The high-substrate scene runs faster | Keep illustrative motion timing comparable; change the condition cue. |
| The final rate is called exactly100 | Use the calculated finite-concentration value or explicitly discuss the limit. |
| A generic pocket is given a protein identifier | Remove the identifier or replace the asset with verified structural input. |
FAQ: competitive inhibition and Vmax
Why is the inhibited rate lower if Vmax is unchanged?
The comparison is at a finite substrate concentration. The ideal competitive model changes the substrate concentration needed for a given rate while preserving the limiting rate.
Does adding substrate make the inhibitor fall off faster?
That is not established by this example. The scene shows reversible release and subsequent binding; the rate equation does not provide a measured release trajectory or residence time.
Is apparent Km the same as binding affinity?
No. Km is a kinetic parameter and is not generally an equilibrium dissociation constant. Use the definition at half the limiting rate for this model.
Can a competitive inhibitor bind outside the exact substrate pocket?
Yes, mutually exclusive binding can arise through more than one spatial arrangement. The shared pocket shown here is one conceptual choice, not a universal structural rule.
Can I present the example as experimental data?
No. The inputs were chosen for a classroom calculation. Label the table and animation as illustrative, and keep any real measurements with their own methods, units and sources.
Try one enzyme comparison in Animiotics
Start with the four-state visual sequence: inhibitor bound, inhibitor released, empty pocket and substrate bound. Use the checked table beside it to explain why a lower rate at one concentration can coexist with an unchanged limiting rate. Review that short sequence before adding the wider classroom comparison.
Animiotics offers a paid introductory trial for eligible new customers. Signing up and using the manual editor are free; generation and exports require a paid plan. Check the current offer on the homepage, then use the brief above to create and review your own conceptual enzyme explanation.