Why Receptor Occupancy Needs A Visual Story
Receptor occupancy visualization services matter because target engagement is often where a promising molecule becomes understandable to a buyer. Many biotech teams can describe affinity, exposure, receptor density, tissue access and downstream response in separate data slides. The harder task is showing how those pieces connect. If the audience cannot see why a dose achieves useful engagement without saturating the wrong biology, the platform story can feel uncertain even when the data are strong.
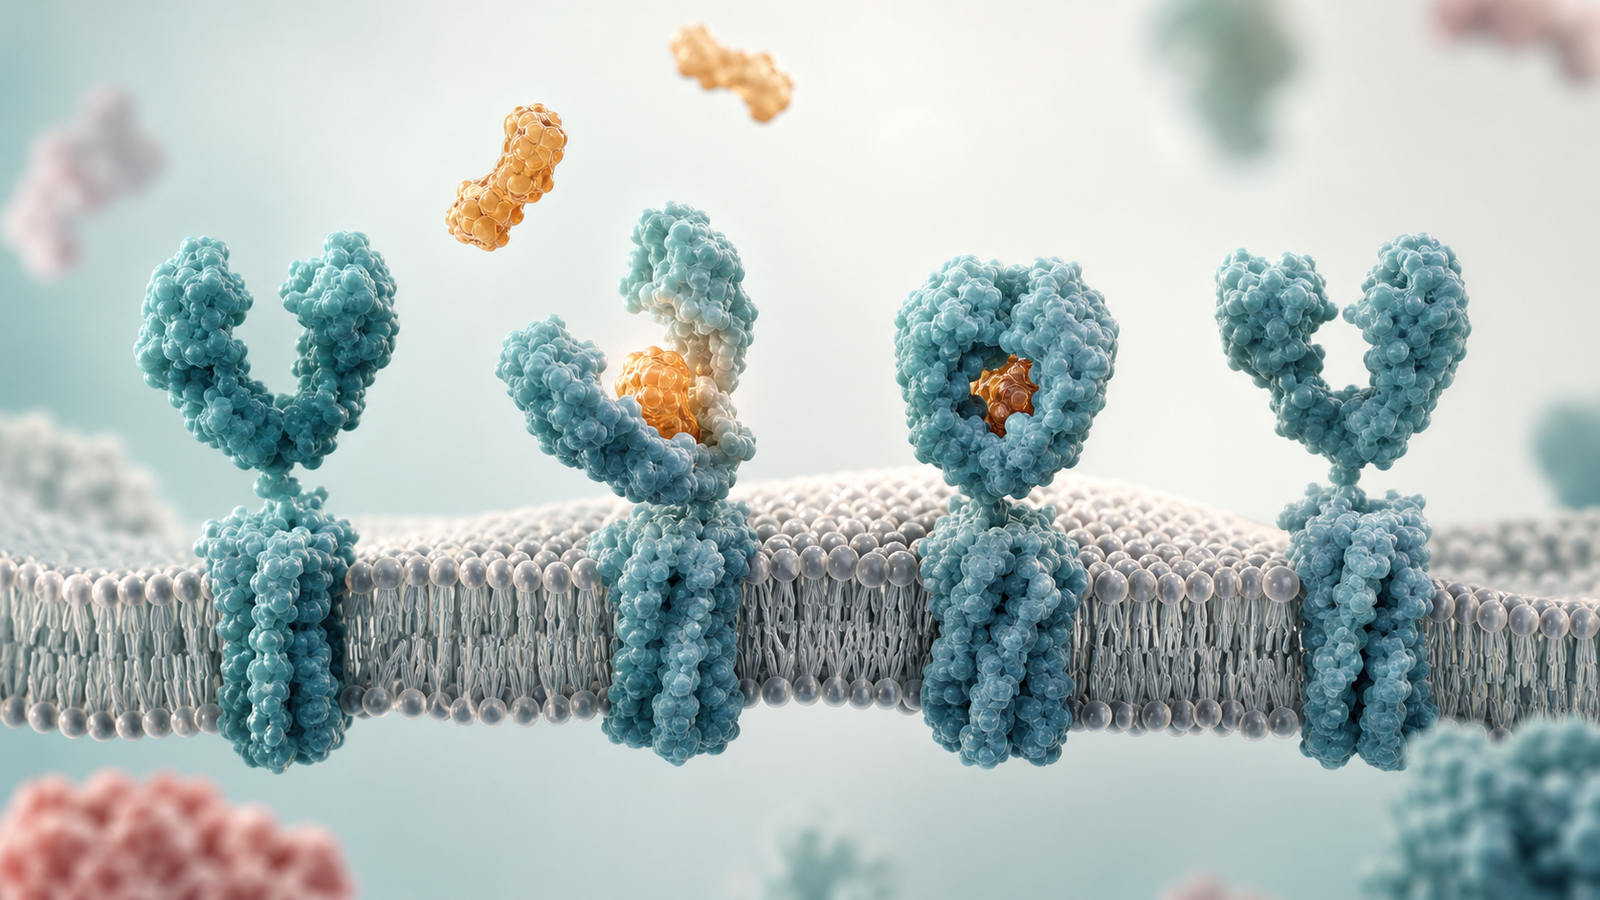
A strong receptor occupancy visual translates quantitative pharmacology into a sequence the viewer can follow. It can show free receptors on a cell surface, drug molecules entering the relevant compartment, binding sites filling over time and downstream biology changing as occupancy crosses a practical threshold. The visual should not pretend that receptor occupancy alone proves efficacy. It should position occupancy as one layer of evidence that links exposure, target engagement, pharmacodynamics and dose rationale.
For business development, fundraising and product communication, that clarity has immediate value. Buyers want to know whether a program has a plausible therapeutic window, whether the assay supports decision making and whether a platform can generalize across targets. A polished 3D animation or still render gives those questions a common visual frame before the team moves into detailed plots and tables.
- Use receptor occupancy visuals when affinity, exposure and biology are scattered across too many slides.
- Show occupancy as a bridge between molecule behavior, target engagement and clinical dose logic.
- Keep the visual grounded in measured evidence instead of turning every receptor into a decorative icon.
What The First Scene Should Explain
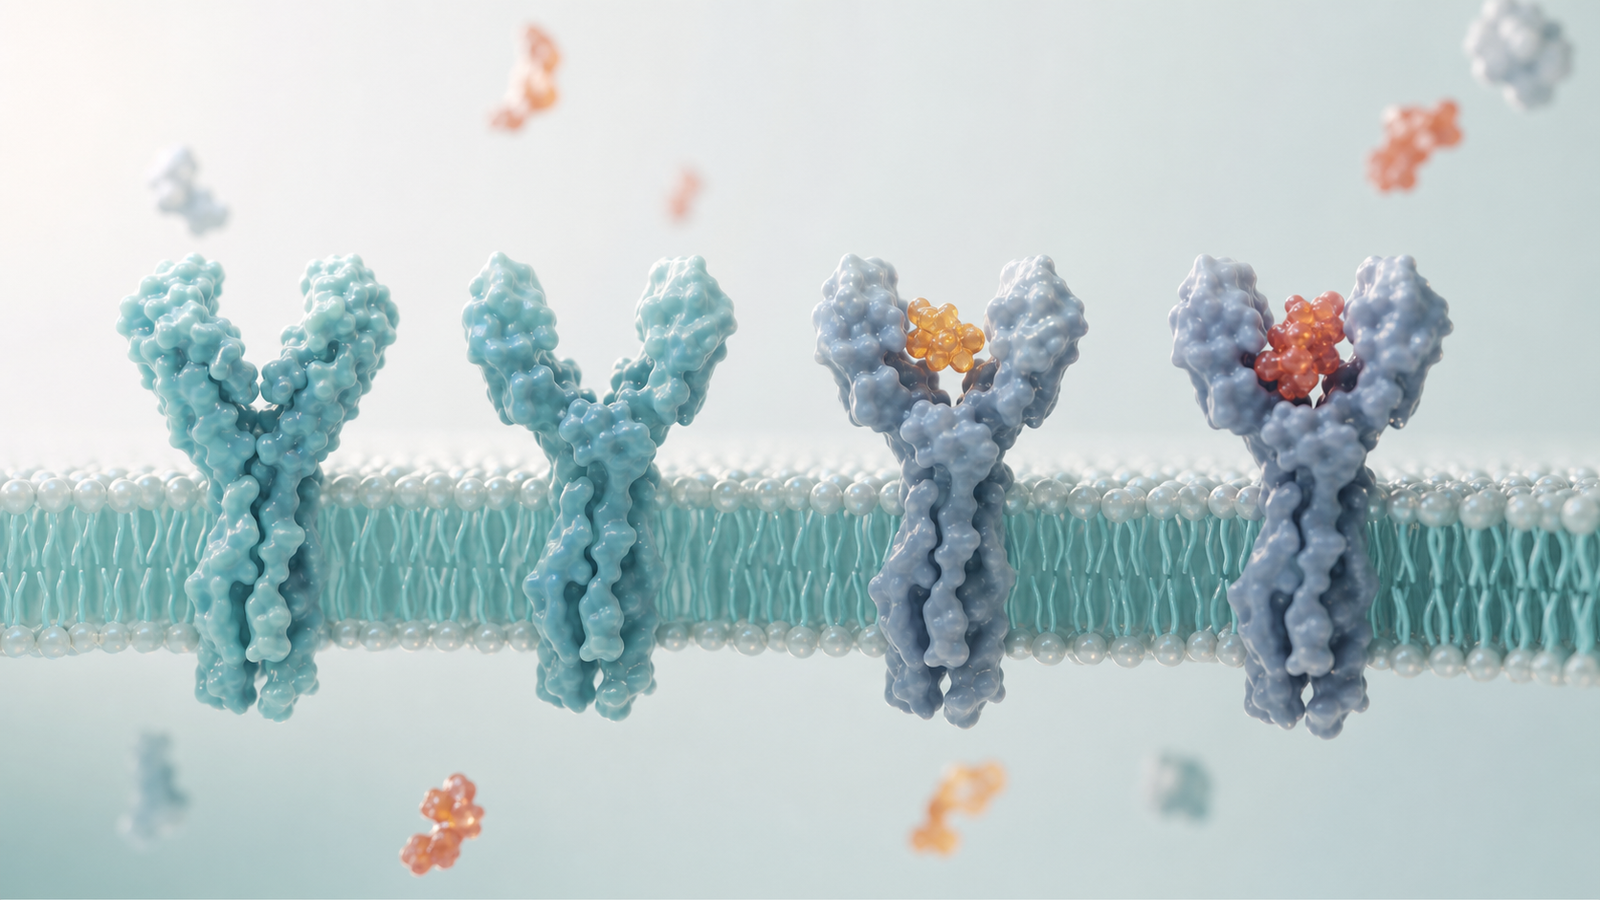
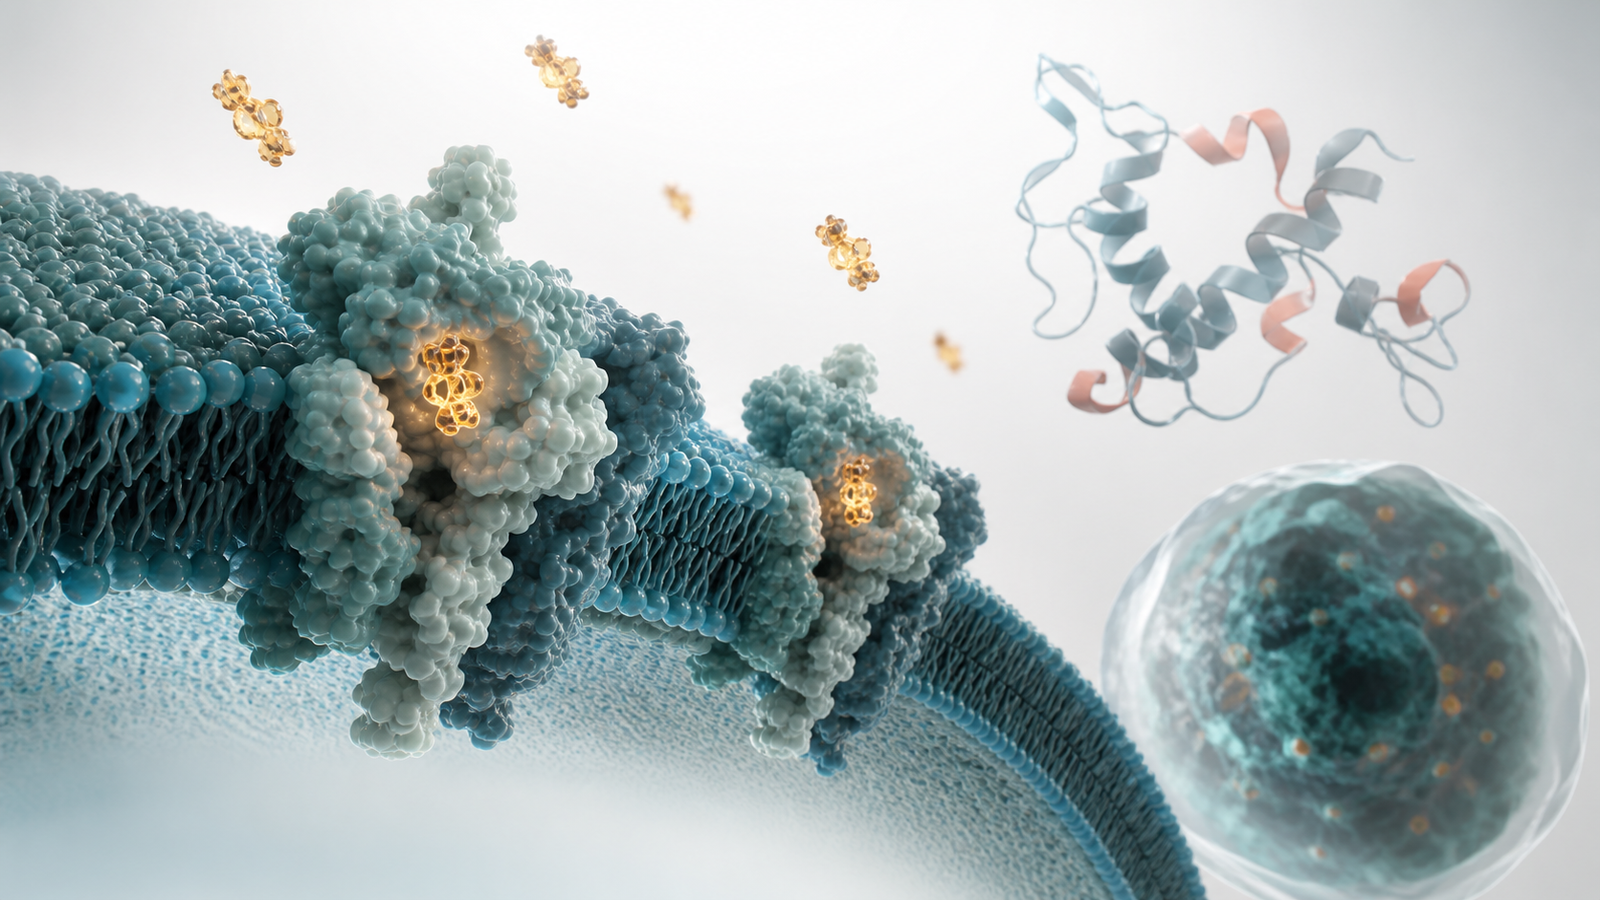
The first scene should make the target context obvious. A membrane receptor, soluble receptor, intracellular target or immune synapse each creates a different communication problem. A cell surface receptor scene can show density, accessibility and competitive binding. An intracellular receptor scene may need transport, compartment entry and reversible binding. A clinical imaging scene may need to connect tissue signal with the same molecular logic without becoming a fake dashboard.
The most useful opening usually starts with one receptor population and one drug class. That could be a monoclonal antibody engaging a membrane target, a small molecule binding a kinase pocket, a radioligand marking receptor expression or a biologic competing with endogenous ligand. The viewer should understand what is being occupied before they are asked to interpret percentages, time courses or dose tiers.
This is also where visual restraint protects the science. Receptor occupancy is already a ratio-driven concept. Crowding the frame with multiple cell types, pathway branches and assay readouts can make the message feel less precise. A clean hero receptor, a few bound and unbound states and a calm cellular environment are usually more persuasive than a busy collage.
- Identify the receptor, compartment and therapeutic class in the first visual beat.
- Separate binding from downstream response so the audience sees the evidence chain.
- Use a single hero subject before adding assay context or platform implications.
| Communication challenge | Visual answer |
|---|---|
| Audience does not understand occupancy | Show receptors shifting from open sites to drug-bound states over time |
| Dose rationale feels abstract | Stage low, target and high exposure as simple comparative scenes |
| Assay evidence feels disconnected | Connect PET, flow, ligand competition or biomarker signal back to binding |
Turning Occupancy Data Into Buyer-Ready Visuals
Buyer-ready receptor occupancy visuals do not need to show every data point. They need to explain the decision the data supports. For an early platform company, that decision may be whether the molecule reaches enough target in the relevant tissue. For a clinical program, it may be why one dose range balances engagement, tolerability and practicality. For a partner-facing deck, it may be how the same assay strategy can derisk a broader target family.
A useful visual hierarchy starts with the biological scene, then introduces measurement. The receptor field shows the event. A restrained occupancy cue shows the proportion engaged. A paired pharmacodynamic cue shows that the biology is moving in the intended direction. If needed, a later section can show exposure response, but the first visual should not look like a chart pasted onto a cell. The audience should feel that the assay is observing a real biological event.
Teams often benefit from building a still image first, then expanding it into animation. A still render can support a blog post, platform page, pitch deck or conference handout. The animation can then use the same visual language to show time, dose and reversibility. This consistency makes the platform feel more mature because every asset reinforces the same scientific model.
- Start from the decision the data supports, then choose the visual structure.
- Use occupancy cues to clarify proportion without creating a fake instrument readout.
- Reuse the same receptor and material language across website, deck and animation assets.
Dose Selection, PK PD And Translational Confidence
Dose selection is where receptor occupancy visuals become commercially useful. A program may have nanomolar affinity and clean in vitro pharmacology, yet buyers still need to understand what happens in vivo. Does the molecule reach the receptor compartment? Is occupancy sustained long enough to matter? Does increased exposure add useful target engagement or mainly add safety risk? A clear visual can frame those questions before the team presents quantitative models.
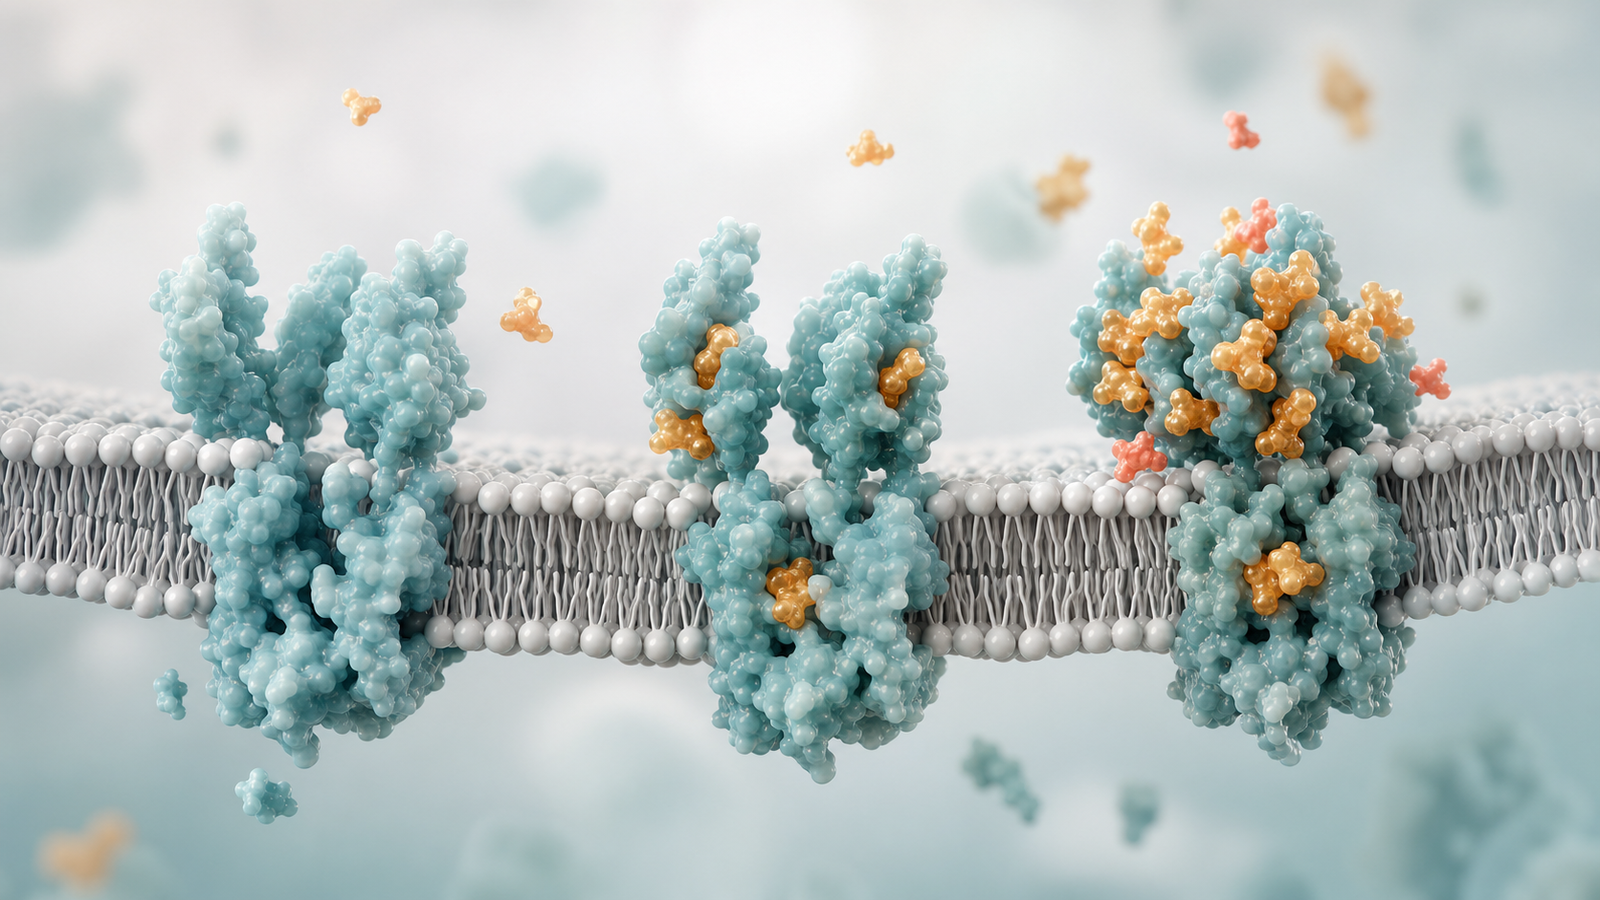
The best dose selection scenes avoid oversimplifying PK PD. Instead of claiming a single percentage proves the right dose, they show a relationship. Low exposure leaves many receptors open and weakens pharmacodynamic effect. A target range produces meaningful occupancy and biological response. Excess exposure may add little incremental receptor engagement while raising off-target or tolerability concerns. That story helps a mixed audience understand why dose optimization is a scientific and commercial decision.
This approach pairs well with related Animiotics content on preclinical pharmacology animation services because receptor occupancy is one way to make dose response feel concrete. It also connects naturally with membrane protein visualization services when the target is a receptor, channel or transporter that needs structural context.
- Show dose as a biological relationship instead of a decorative scale.
- Connect occupancy to pharmacodynamic signal, tissue access and safety margin.
- Use visual transitions to explain why more exposure is not always more value.
| Dose story | Visual emphasis | Buyer takeaway |
|---|---|---|
| Low exposure | Sparse binding across the receptor field | Target engagement may be insufficient |
| Target range | Readable receptor engagement with a clear biology cue | Dose rationale has mechanistic support |
| High exposure | Saturation with limited extra response | Optimization should consider safety and practicality |
Visual Choices That Build Scientific Credibility
Receptor occupancy can look artificial if the visual language is too literal. A scene filled with identical glowing dots may communicate percentage, but it rarely builds confidence in the underlying biology. Scientific credibility comes from showing plausible receptor surfaces, appropriate membrane context, realistic molecular scale and restrained lighting. The goal is not photoreal microscopy. The goal is a polished scientific render that feels engineered, specific and useful.
Material choices matter. Receptors can have subtle protein surfaces, ribbon hints or structured extracellular domains. Membranes can be clean enough for readability while still showing lipid texture. Drug molecules can be simplified without becoming toy-like. Binding states should be distinct, but not so bright that the scene looks like an infographic. A restrained biotech palette of muted teal, pearl white, silver gray, warm amber and sparse coral accents keeps the frame premium.
Accuracy also depends on what the visual leaves out. If the program does not use imaging, the render should not imply PET. If receptor internalization is not part of the mechanism, the animation should avoid suggesting it. If occupancy is inferred from a surrogate tissue, the story should make that evidence chain clear. A trustworthy visual helps the team explain uncertainty as well as confidence.
- Use realistic biomolecular surfaces and lab-grade materials instead of generic glowing beads.
- Avoid fake labels, fake dashboards and visual claims that the data do not support.
- Make binding states readable while preserving a premium 3D scientific render style.
Where Receptor Occupancy Visuals Create Commercial Leverage
Receptor occupancy visualization services can support several buyer-facing moments. On a website, a hero render can tell visitors that the company understands target engagement and dose rationale. In an investor deck, a short sequence can make the clinical development plan feel more disciplined. In a partnering meeting, the same visual system can explain why a platform can measure engagement across multiple targets without overclaiming identical biology.
The assets are especially valuable when the company has strong assays but a complex explanation. Flow cytometry occupancy assays, ligand competition studies, tracer imaging, ex vivo binding, soluble receptor measurements and translational biomarkers each have different audiences. A visual system can show how those methods support the same core question: whether the therapeutic engages the intended target in the right place, at the right level and for the right duration.
For teams planning a larger content strategy, receptor occupancy also links to broader mechanism communication. It can sit beside mechanism of action animation, pharmacology visuals, structural binding renders and platform storyboards. The result is a coherent set of assets that help scientific, executive and commercial teams explain the same program without rebuilding the story for every meeting.
- Use one visual system across website, pitch deck, conference booth and partner meetings.
- Translate assay evidence into a clear target engagement story for mixed audiences.
- Position receptor occupancy as part of a larger platform communication toolkit.
FAQ
What are receptor occupancy visualization services?
AReceptor occupancy visualization services create still images, animations and presentation visuals that explain how much of a target receptor population is engaged by a therapeutic molecule under specific exposure conditions.
Who uses receptor occupancy visuals?
ABiotech companies, pharma teams, translational pharmacology groups, clinical development teams and platform companies use these visuals when they need to explain target engagement, assay evidence, dose rationale or program value to investors, partners, clinicians or internal decision makers.
Can receptor occupancy be shown without oversimplifying the science?
AYes. The visual should show occupancy as one layer in an evidence chain rather than a standalone proof of efficacy. A credible sequence connects exposure, receptor binding, pharmacodynamic effect and dose selection while leaving room for uncertainty.
What assets can Animiotics build from a receptor occupancy story?
AAnimiotics can build website hero renders, pitch deck figures, mechanism animations, section images, storyboard frames, launch visuals and reusable 3D scenes that support receptor occupancy and target engagement communication.
Ready To Build A Receptor Occupancy Visual
A strong receptor occupancy story starts with the target, the evidence and the decision your audience needs to make. Animiotics can turn that material into premium 3D scientific renders and animation-ready scenes that explain target engagement, dose selection and platform value with the clarity buyers expect.
Start with the receptor context, the molecule class, the assay type and the commercial moment the asset needs to support. From there, the visual can be scoped as a single hero image, a set of section renders or a full animation sequence. For related planning, review Animiotics work on scientific animation services for biotech and then visit Animiotics to discuss a receptor occupancy visual for your program.
- Use receptor occupancy visuals when target engagement is central to buyer confidence.
- Bring assay context, dose rationale and platform claims into one coherent visual system.
- Plan still renders and animation scenes together so the communication stays consistent.