What overlap can establish
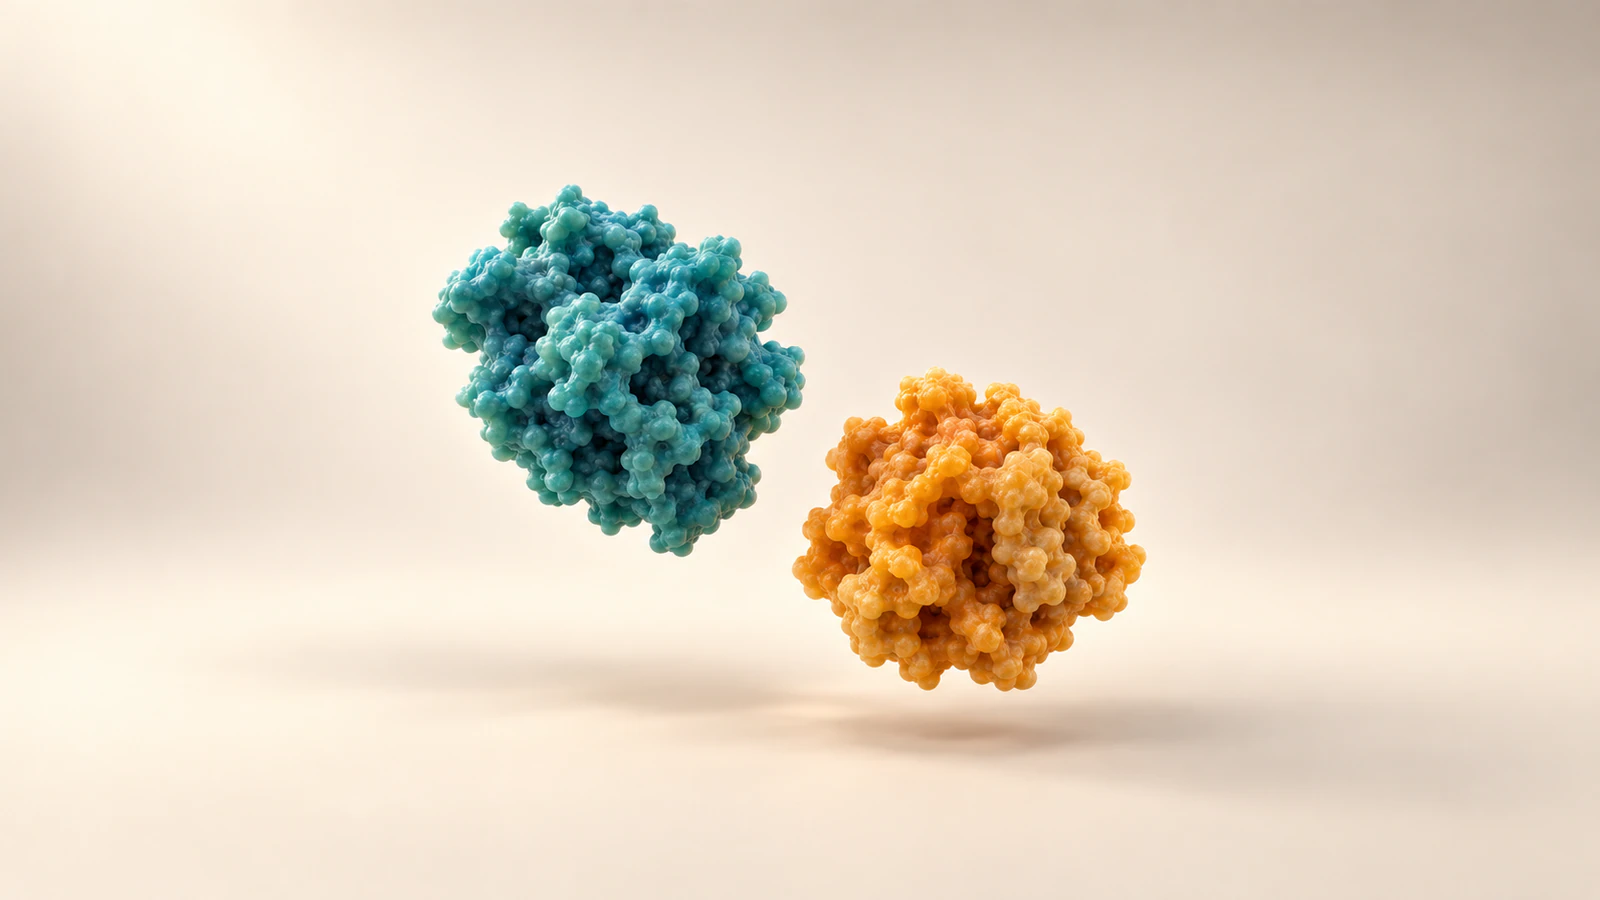
Colocalization and molecular interaction answer different questions. Spatial colocalization describes how two labels occupy an image at a defined scale; it does not, by itself, show that their molecules bind. An animation should preserve that distinction by showing shared location without inventing a docking event.
For a biotech team explaining fluorescence results, the practical decision is what movement the evidence permits. Two signals in the same cellular region can support a scene about localization. Making the corresponding proteins snap together adds a different claim, even if the narration never says “binding.”
This guide develops a hypothetical two-protein example for a product presentation or research explainer. You can use the scene plan in Animiotics, then review the generated geometry and motion against your evidence. The illustrations are conceptual CGI, not microscopy images or reconstructions of a measured molecular arrangement.
Define the observation first
Write the observation before choosing a camera or material: “The two labels overlap within the analyzed region under these acquisition and analysis conditions.” Replace that sentence with the actual result your study supports. Specify whether you mean shared objects, overlapping signal or a relationship between channel intensities.
A channel is an image recording associated with a particular signal. The Microscopy for Beginners guide distinguishes co-occurrence from intensity correlation. Those are useful starting categories because “they are together” can otherwise hide several different measurements.
Keep the biological nouns equally precise. A label for a compartment and a label for a protein are not interchangeable with two directly interacting proteins. In the production handoff, name what each label reports and note whether the animation represents the labeled target, the label itself or the larger structure.
Keep resolution separate from contact
Spatial resolution concerns distinguishable detail, not how large you display an image. Enlarging a fluorescence image does not establish an atomic interface. ImageJ’s colocalization guidance therefore ties interpretation to the spatial scale of the measurement and warns against inferring molecular binding from colocalization alone.
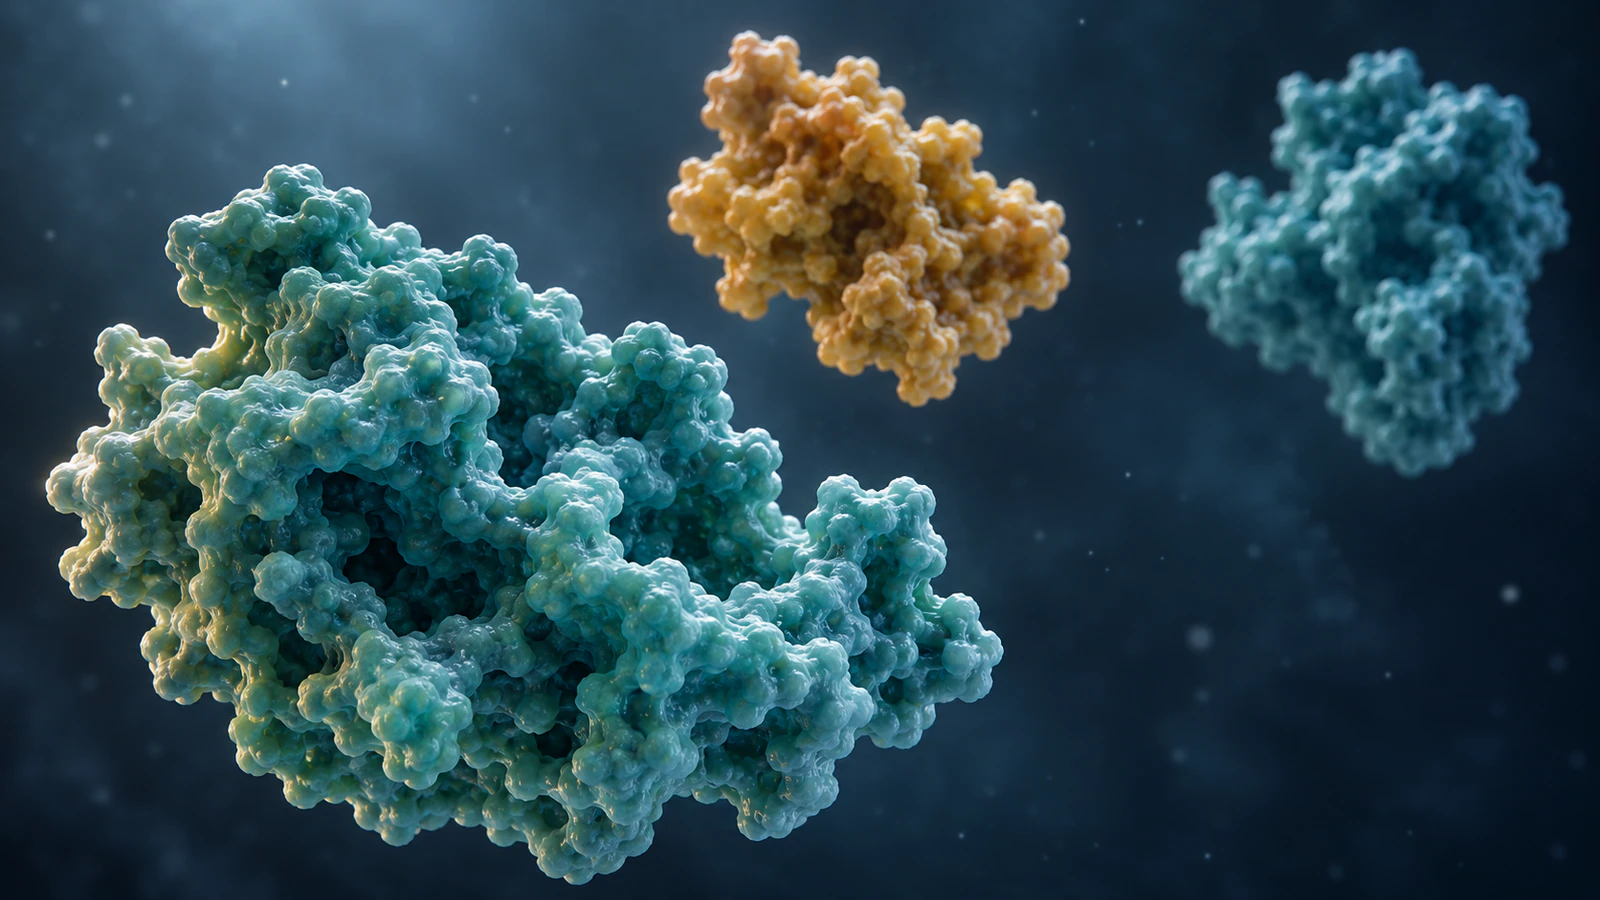
For the animation, record two separate scales: the biological region being explained and the illustrative size of the proteins on screen. If the protein surfaces are invented teaching shapes, say so. Do not attach an experimental scale bar to a conceptual close-up unless the geometry has a defensible calibration.
A useful visual is two separated proteins viewed along a direction that partly hides their separation. Rotate the camera to reveal the gap while leaving both objects fixed. This demonstrates a geometric ambiguity. It does not reproduce the instrument’s optical response or prove where molecules sat in the original sample.
Choose verbs that match the evidence
The most consequential review often concerns a verb. “Shares a region with” asks for placement; “binds” asks for a contact event; “activates” adds a functional change. Approve these verbs before an attractive render makes a stronger story feel inevitable.
Use the following record at the level of each shot. The examples are production decisions, not a hierarchy in which one experiment automatically proves the next. A separate interaction claim needs its own appropriate methods, controls and interpretation.
| Evidence available | Permitted scene direction | Inference to avoid |
|---|---|---|
| Spatial overlap of two labels | Show both populations within the stated region | One-to-one molecular docking |
| Intensity association across analyzed pixels | Explain the reported relationship with its analysis context | A percentage of molecules bound |
| Static image at one time point | Hold the conceptual arrangement while moving the camera | An observed arrival or recruitment sequence |
| Separate, reviewed interaction evidence | Depict only the supported contact or relationship | An exact interface or kinetic rate without evidence |
Do not turn a coefficient into a cast count
Pearson correlation describes a linear relationship between channel intensities. Manders split coefficients describe channel-signal overlap using specified definitions and thresholds. The Huygens technical explanation lays out these distinctions and the influence of analysis choices.
Neither name is a license to populate a scene with a corresponding fraction of bound proteins. If a slide reports a coefficient, retain its actual label and analysis context. Do not translate it into “this many molecules interact” or paint that fraction of particles as complexes.
For a nontechnical audience, keep the numerical result beside the real figure and use the animation to explain the question being measured. A presenter can say what the channels represent and what comparison was made. This division gives the animation a clear job without making it an imitation quantitative assay.
Make controls visible in the handoff
A convincing overlap image can still have acquisition problems. The microscopy reference guide identifies channel shift, bleedthrough and inadequate controls as interpretation risks. Bleedthrough means that signal associated with one label contributes to another channel; channel shift means that corresponding features are spatially misregistered.
Ask the scientist responsible for the data to identify which checks were performed and which limitations remain. Keep the answer attached to the shot specification. The ImageJ acquisition guidance is a useful discussion starting point, rather than a replacement for an instrument-specific protocol.
Do not “correct” the experimental image by moving bright regions until the overlap looks stronger. In a conceptual scene, placement is illustrative; in a data figure, placement is evidence. Store these assets separately and describe them differently in captions so a polished render cannot be mistaken for a processed measurement.
Build a six-shot explanation
Consider a hypothetical team with static images showing two labeled soluble-protein populations in the same cellular region, but no reviewed binding experiment. Its communication goal is to explain the localization result and the remaining uncertainty. Teal and amber identify the two populations throughout.
The proposed sequence below uses a camera move to make the distinction legible. The particles stay fixed during the depth demonstration. The scene contains no fitted optical model, measured trajectories or claimed protein structures; its timing is chosen for comprehension.
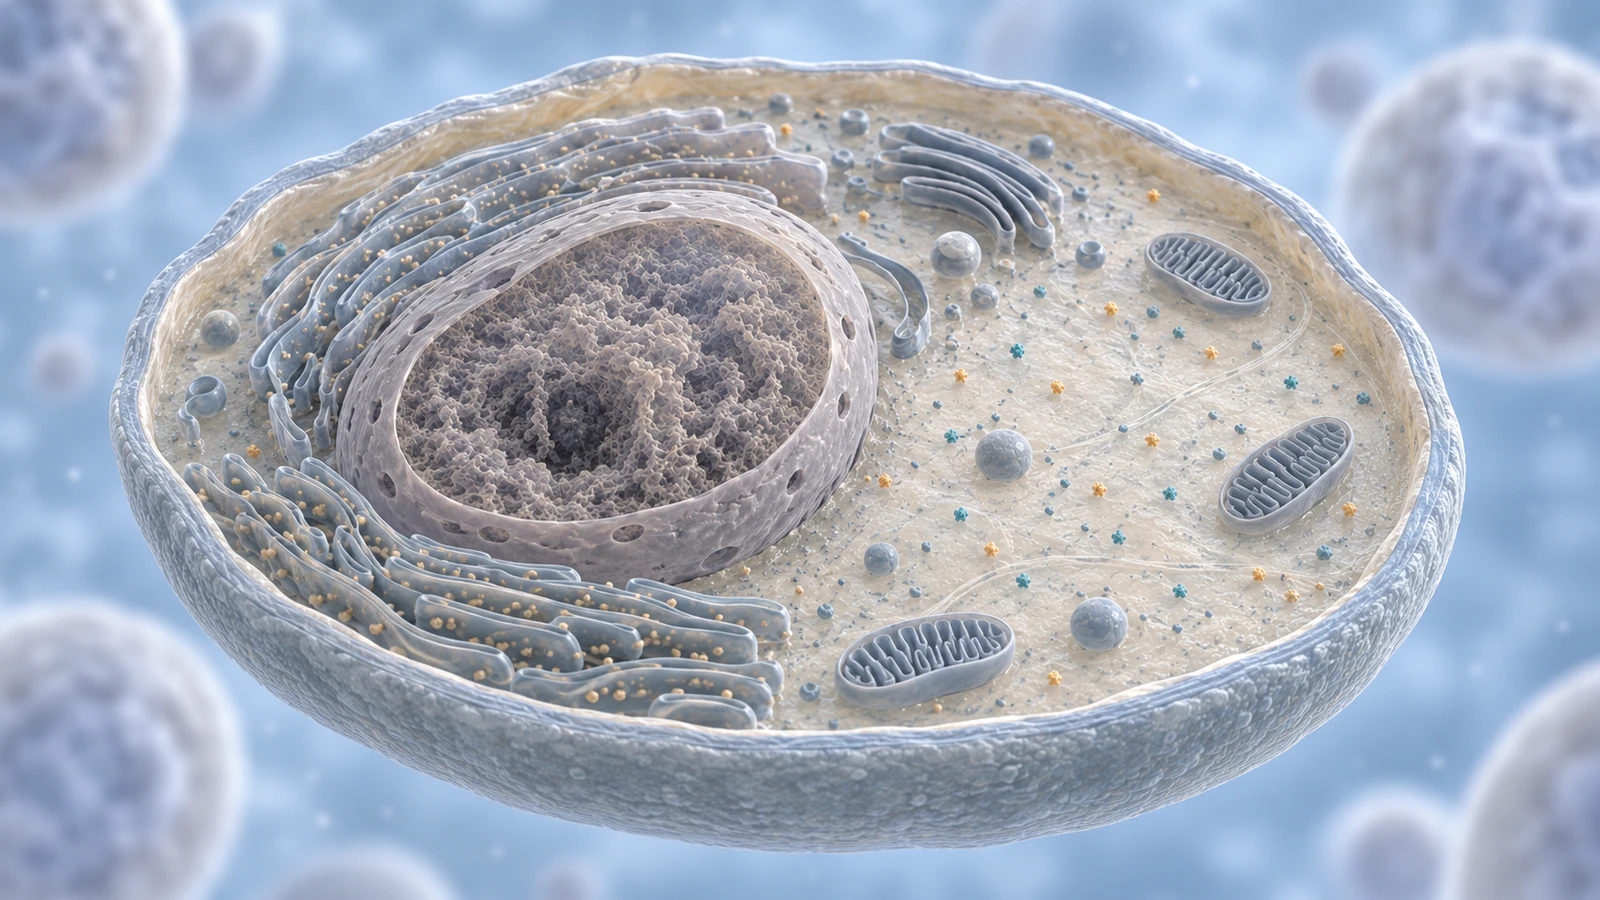
- Establish the cellular region and introduce the two population colors. Keep the background sparse enough to read at presentation size.
- Move closer to one shared region. Keep both populations visible without pairing every teal object with an amber partner.
- Pause on a view where some objects overlap in screen space. Explain that a projection alone leaves depth ambiguous.
- Orbit the camera around the fixed arrangement until the separation is visible. Do not animate the particles pulling apart.
- Return to the wider region. Preserve the same identities and explain what the localization evidence supports.
- End with the real evidence statement and the unresolved interaction question in the accompanying narration or slide. Do not finish on an invented bound complex.
Translate the plan into Animiotics
Animiotics lets you describe a scientific scene and work with editable objects, materials, lighting and timing. Start with the smallest shot that carries the distinction: two separated populations and a camera move. A first generated scene is a draft to inspect, not a scientific validation.
A hypothetical starting prompt is: “Create a conceptual cellular close-up with two distinct soluble-protein populations, muted teal and warm amber. Keep every protein separate. Hold the particles still while the camera slowly changes angle to reveal depth between objects that overlap in the initial view. No binding, fusion, attraction, connectors or measured distances. Keep the setting uncluttered.”
This prompt has not been benchmarked as a tested output. Review what the product actually creates and correct any unintended contact or motion. For a fuller handoff, use the biology animation storyboard guide to connect each shot to its evidence statement.
Review the motion with sound off
Watch the draft without narration. A viewer who sees two objects lock together will likely infer interaction, even if a voiceover later adds a qualification. Likewise, coordinated travel or a new shared glow can communicate a relationship you did not intend to claim.
Check the initial frame, midpoint and endpoint of the camera orbit. The spatial arrangement should remain unchanged during this illustrative reveal. If the software has also moved the proteins, correct that movement before adjusting lighting or adding more detail.
Then show the sequence to someone outside the project and ask what happened to the proteins. Their answer is a practical comprehension check, not an experimental validation. If they describe binding, rewrite the scene direction. The molecular color continuity guide can help prevent identity changes from creating another unintended story.
Deliver the figure and illustration together
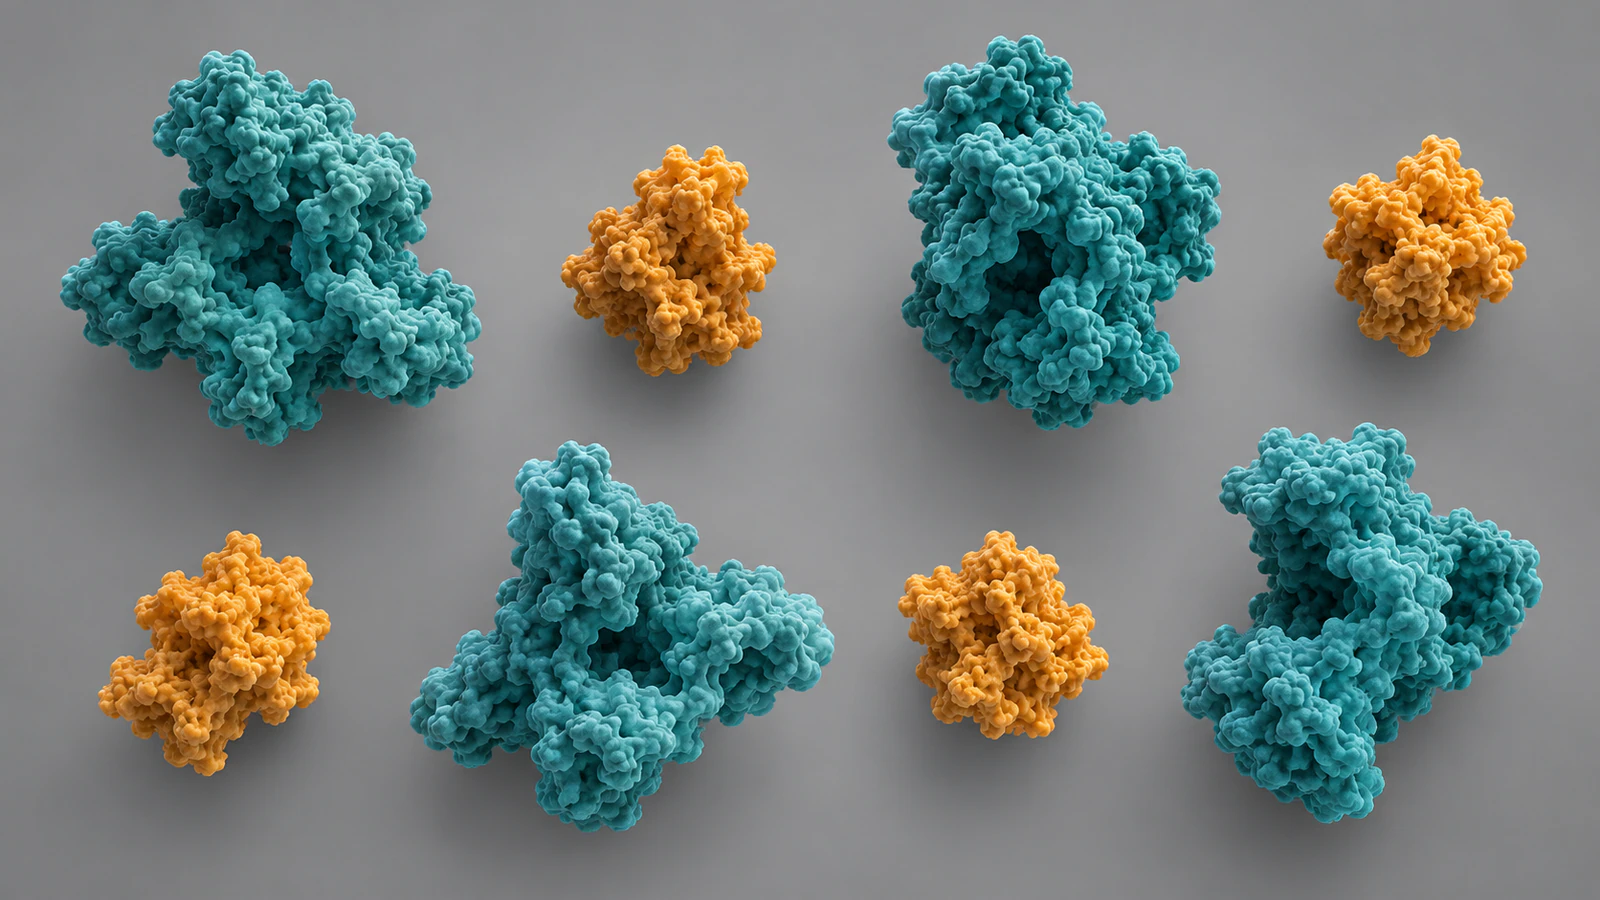
Keep the real result and the explanatory scene easy to distinguish in the final presentation. A figure can carry the acquisition details, analysis method and measured values. The animation can carry the spatial concept and the question the audience should understand.
A suitable illustration caption is: “Conceptual arrangement showing two protein populations in a shared region; positions and surfaces are illustrative and do not establish direct interaction.” Adapt the wording if your scene has a different purpose. Do not call the image a reconstruction simply because it was inspired by microscopy.
For the final review record, save the approved evidence sentence, source figure identifier, analysis description, allowed actions and remaining uncertainty. Name the person who can resolve scientific questions. That compact record makes a later edit, such as adding a contact event, an explicit scientific decision rather than an unnoticed visual embellishment.
FAQ: Colocalization and interaction
Does colocalization prove that two proteins bind?
No. Spatial colocalization describes their labels at the scale and under the conditions of the imaging analysis. Direct binding is a different claim that needs appropriate supporting evidence.
Does a yellow merge prove colocalization?
A merged display can suggest overlap, but its colors are display choices. Interpret the underlying channels with an appropriate quantitative method and controls rather than treating one composite color as proof.
Can a high Pearson coefficient be shown as a bound fraction?
No. An intensity correlation coefficient is not a count of bound molecules. Keep the reported statistic in its analysis context and avoid converting it into molecular stoichiometry.
Can I animate movement from a static image?
You can create a clearly identified conceptual sequence, but a static image alone does not supply an observed trajectory. In the example here, only the camera moves during the depth demonstration.
Can Animiotics verify my microscopy result?
This workflow uses Animiotics to create and edit an explanatory animation. It does not replace image analysis, acquisition controls or scientific review, and an AI-generated scene does not establish an interaction.
Try a shared-location scene
Try Animiotics with one focused animation: two protein populations sharing a cellular region while a camera orbit reveals their separation. Use your approved evidence sentence to decide what the objects may do, then inspect every frame for unintended docking or coordinated motion.
You can join without a card; the current homepage states that AI generation and exports require a paid plan. Start by deciding the one distinction your audience should remember: shared location and direct binding are different claims.