Why Tumor Microenvironment Visualization Matters
Tumor microenvironment visualization matters because modern oncology stories rarely depend on tumor cells alone. A program may need to explain immune exclusion, stromal density, abnormal vasculature, hypoxia, antigen presentation, cytokine signaling, myeloid suppression, therapeutic penetration and patient stratification in one coherent message. Each layer can be scientifically important, but a buyer will only remember the platform claim if the visual hierarchy is clear.
For biotech teams, the communication challenge is practical. A discovery group may need to show why a model captures tumor immune biology. A platform company may need partners to understand how its therapeutic reaches the tumor compartment. A translational team may need to connect biomarker evidence to spatial context. A business development deck may need to show why a differentiated oncology mechanism deserves a second meeting.
A strong tumor microenvironment visualization gives the audience a simple map before it introduces mechanism. It separates tumor nest, stroma, immune cells, vasculature and signal activity so the viewer can understand where the claim lives. The goal is not to decorate a cancer slide. The goal is to make a complex oncology story legible enough that scientific, commercial and investor audiences can act on it.
- Use TME visuals when spatial context changes how the mechanism should be understood.
- Keep tumor cells, immune compartments, matrix barriers and vascular access visually distinct.
- Build assets that can support pitch decks, posters, web pages and animation.
Start With the Oncology Claim
The first planning question is what the tumor microenvironment visual must prove. Some teams need to show immune infiltration. Others need to explain exclusion at the tumor boundary, stromal remodeling, macrophage polarization, payload delivery, checkpoint biology or combination therapy logic. Each claim needs a different visual structure. A generic tumor blob with scattered cells will not carry enough meaning for a buyer.
If the claim is immune access, the visual should show where immune cells are relative to the tumor nest and what changes after treatment. If the claim is delivery, the visual should show vascular entry, tissue penetration and regional response. If the claim is patient selection, the figure may need a small set of spatial phenotypes that compare inflamed, excluded and immune-desert tumors without becoming a diagnostic atlas.
This discipline is similar to the planning behind organoid model visualization. The model may contain many biological details, but the commercial story depends on one primary claim. Tumor microenvironment visualization should turn that claim into a visual sequence the audience can follow quickly.
- Define whether the asset sells a mechanism, a platform, a program or a translational workflow.
- Choose one primary spatial relationship before adding pathway or assay detail.
- Use one visual system if the company works across multiple tumor types.
Map Compartments Before Showing Pathways
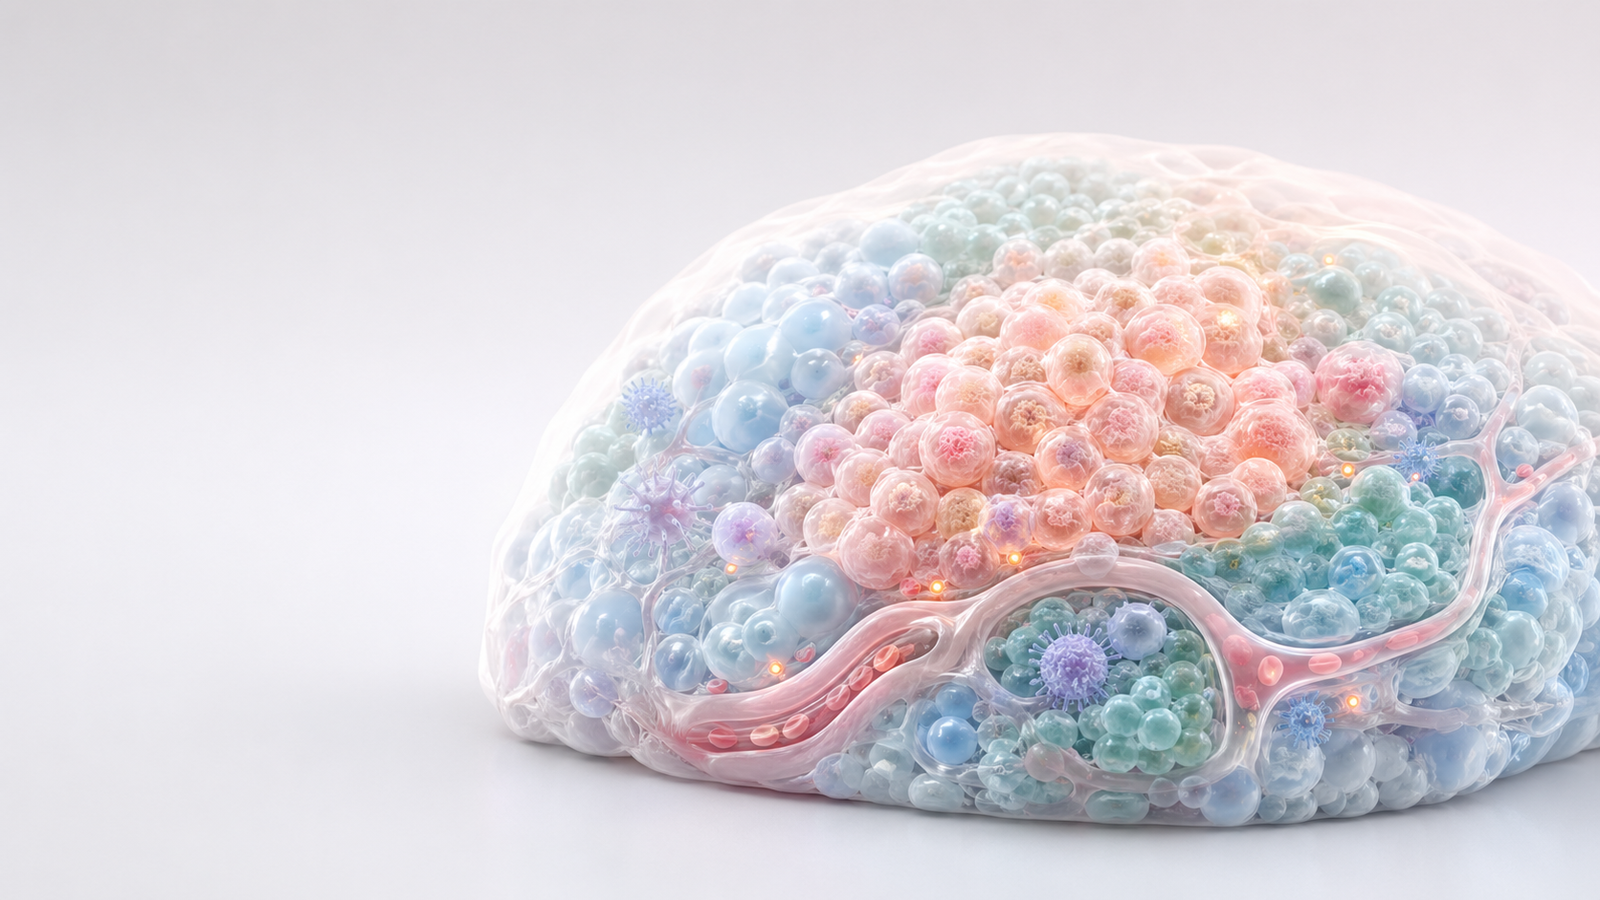
Most weak TME figures begin too late. They open with ligand names, receptor arrows and pathway objects before the viewer understands the physical scene. A clearer approach starts with compartments. Show the tumor nest. Show the stromal region. Show where immune cells sit. Show whether vessels are open, compressed or distant. Once the map is readable, the mechanism has a place to happen.
This order is useful for buyer-facing work because it lowers cognitive load. A partner does not need every cytokine in the first frame. They need to see whether the therapy must cross a barrier, recruit an immune cell, reshape the matrix or activate a response at a specific interface. The map makes the later molecular details feel grounded rather than abstract.
The visual can stay scientifically restrained. A TME render does not need to imitate histology pixel for pixel unless the asset is tied to a specific data figure. For platform communication, a clean 3D abstraction can show compartments, density and access while avoiding false precision. The important question is whether the abstraction helps the audience understand the claim without implying evidence the team does not have.
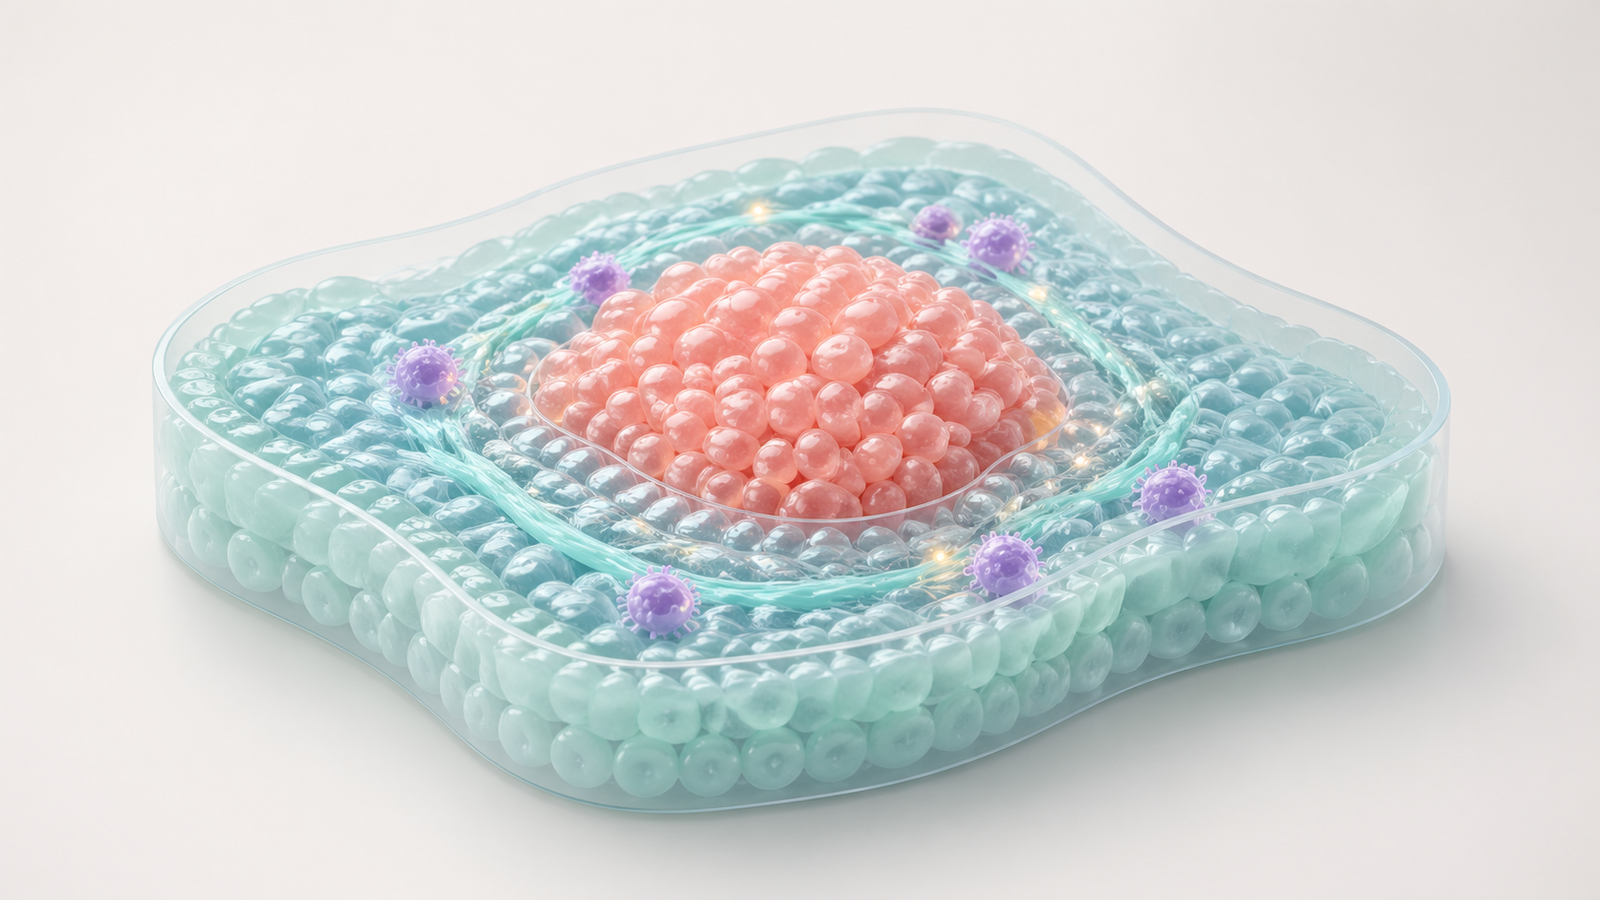
- Introduce tumor, stroma, immune cells and vessels as separate visual roles.
- Use soft boundaries and controlled color so the scene reads at presentation speed.
- Add molecular signals only after the spatial context is clear.
Turn Immune Contexture Into a Clear Story
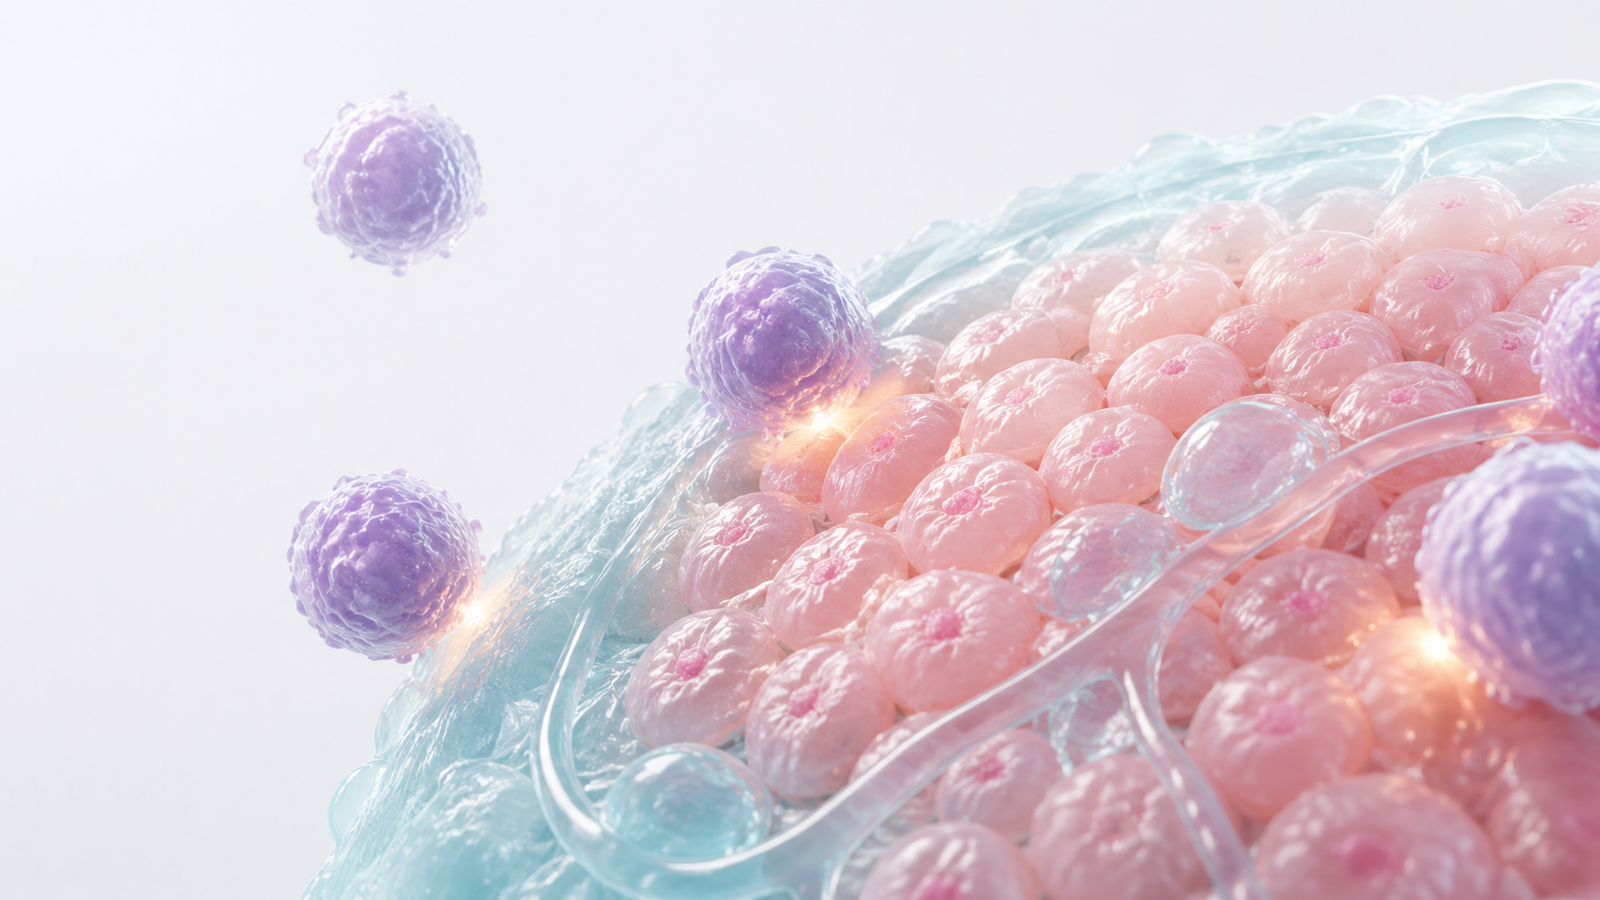
Immune contexture can be one of the most valuable parts of a tumor microenvironment story. It can show whether cytotoxic cells enter the tumor, whether suppressive myeloid cells dominate the stroma, whether checkpoint engagement happens at the tumor boundary or whether a therapy shifts the local immune state. In a static slide, those ideas often become crowded markers. In a planned visual system, they become a sequence.
For immuno-oncology animation, the sequence can start with a quiet tumor map, then introduce immune cells as a separate layer. The next beat can show contact at the tumor edge, localized activation, cell entry or signal release depending on the mechanism. This keeps the audience focused on cause and effect rather than asking them to decode a dense pathway panel.
The same timing logic appears in CAR T mechanism of action animation. The audience needs to follow recognition, contact and response in the right order. A tumor microenvironment version adds spatial barriers and immune context, which makes the visual plan even more important.
- Separate immune-cell location from immune-cell state.
- Show contact, activation and response as distinct beats when motion is available.
- Avoid turning every immune marker into a separate color.
| TME Feature | What It Explains | Best Visual Use |
|---|---|---|
| Inflamed margin | Immune cells collect near the tumor boundary | Checkpoint, bispecific and cell therapy stories |
| Excluded stroma | Cells remain outside the tumor nest | Barrier, matrix and remodeling claims |
| Regional response | Only selected compartments change after treatment | Combination therapy and biomarker stories |
Show Delivery and Penetration Without Clutter
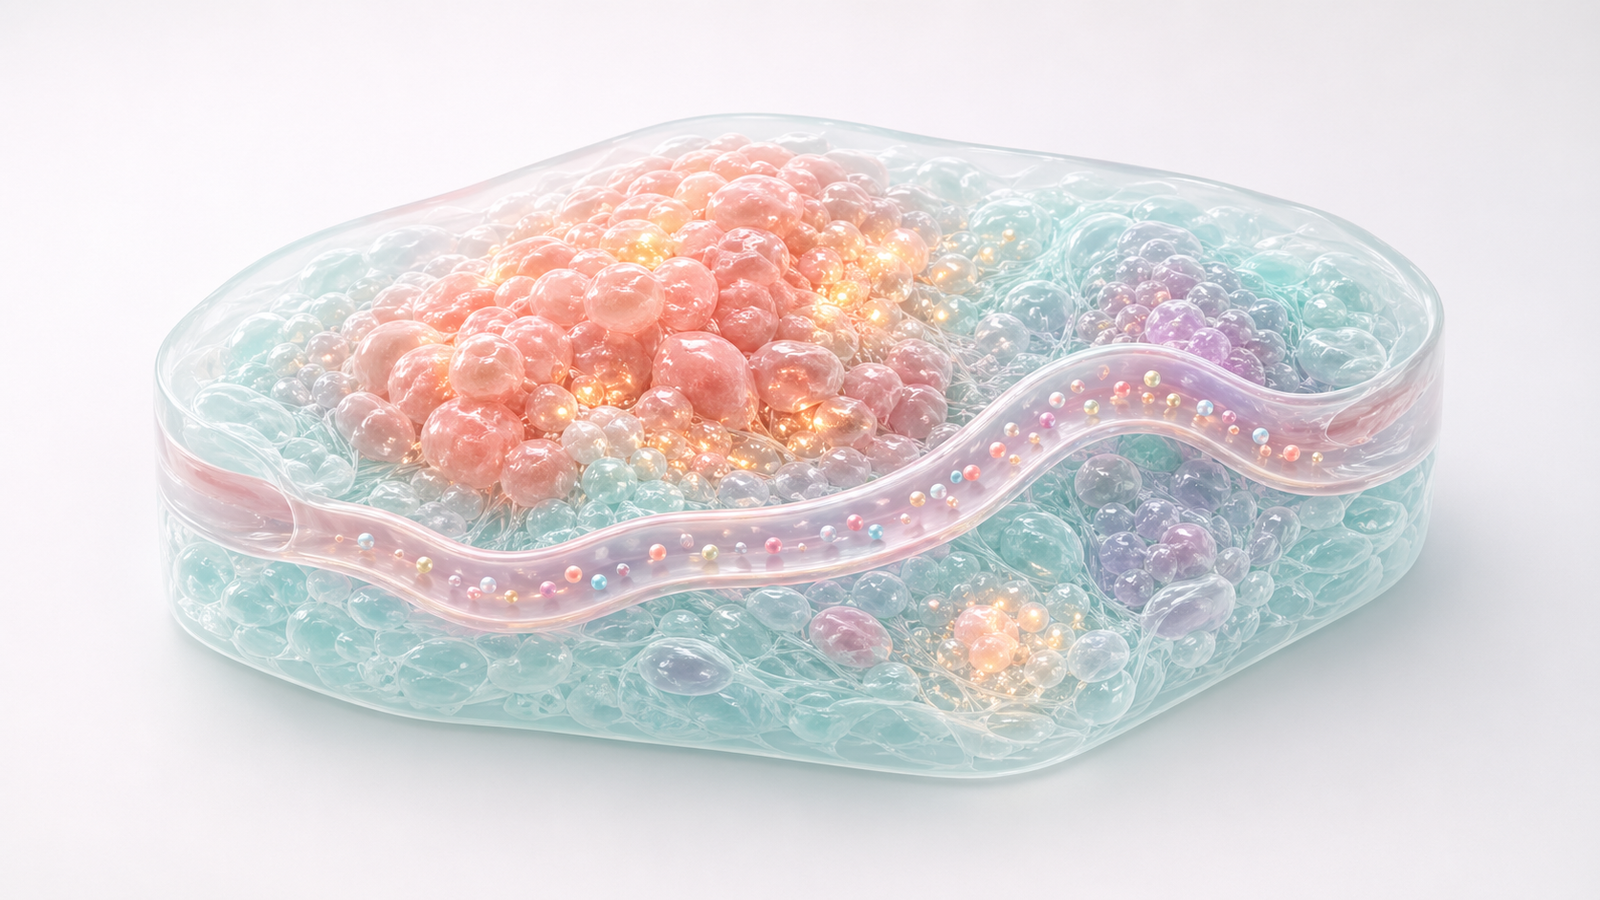
Drug delivery is another high-intent use case for tumor microenvironment visualization. Oncology teams often need to explain how a therapeutic leaves the vasculature, moves through matrix, reaches tumor cells and produces a local response. This applies to antibodies, ADCs, nanoparticles, cytokine therapies, radiopharmaceutical concepts and local delivery strategies. The visual should make transport easy to follow before it adds mechanism detail.
A practical sequence starts with a vessel or access route, then shows therapeutic particles entering the tissue, then shows diffusion or binding, then ends with a regional response. Each step can be a still for a deck or a beat in an animation. The key is restraint. If every particle, receptor and pathway is shown at once, the delivery story loses its path.
This approach connects naturally to antibody drug conjugate mechanism of action animation. ADC communication often focuses on binding, internalization and payload release. A TME visual can add the upstream question that buyers care about: whether the therapeutic reaches the right compartment with enough clarity to support the claim.
- Use one clear route for delivery before showing local mechanism.
- Keep therapeutic particles visually different from immune cells and assay signals.
- Show penetration limits honestly when barriers are central to the story.
Connect Spatial Biology Evidence to Platform Messaging
Many oncology platforms now depend on spatial evidence. Multiplex imaging, spatial transcriptomics, single-cell analysis and pathology workflows can show where cell states and signals appear inside a tumor. The communication task is to connect that evidence to a message a buyer understands. A figure should not simply repeat the data output. It should translate spatial evidence into a platform claim.
A useful structure pairs the data-derived concept with a clean explanatory render. The render shows the compartment logic. The supporting figure or caption explains the evidence behind it. This is especially helpful when the platform story spans discovery, patient selection, mechanism validation and partner-facing positioning. The same core visual can serve many contexts if the system is designed carefully.
The planning principles overlap with single-cell multiomics visualization. Complex data becomes more useful when the viewer can see what it means biologically. Tumor microenvironment visualization should make spatial biology feel like evidence for a decision, not a decorative layer on top of an already crowded slide.
- Translate spatial evidence into one platform claim per asset.
- Use renders to explain compartment logic while data figures support credibility.
- Keep color meaning stable across web, deck and conference formats.
Build Reusable TME Assets for Campaigns
A strong tumor microenvironment visualization should become more than one hero image. The tumor nest, stromal field, immune-cell set, vessel channel, therapeutic particles and response glow can become a reusable asset kit. That kit can support investor slides, mechanism explainers, conference loops, website sections, partner follow-ups and scientific posters with a consistent visual language.
Reusable assets also make scientific review easier. Teams can approve the abstraction once, then adapt the same scene for immune exclusion, delivery, biomarker response or combination therapy. Commercial teams get stills and motion assets that reinforce one message across touchpoints. Scientific teams get a controlled way to avoid overclaiming while still making the biology understandable.
For oncology companies, that consistency matters because the story often evolves. A platform may begin with one tumor type, then add new indications, new combinations or new translational endpoints. A modular TME system lets the visuals grow with the program rather than forcing a new art direction every time the deck changes.
- Plan cover images, section renders, slide crops and animation frames together.
- Keep cell types, vessels and response signals consistent across campaign assets.
- Create modular states for inflamed, excluded and treated tumor scenes.
FAQ About Tumor Microenvironment Visualization
What is tumor microenvironment visualization?
ATumor microenvironment visualization is the process of turning tumor cells, immune context, stromal barriers, vasculature, therapeutic delivery and spatial evidence into clear figures, 3D renders or animations for oncology communication.
When should an oncology team use animation instead of a static figure?
AUse animation when timing, delivery, immune engagement or regional response affects the story. Use a static figure when the main need is a clean overview, platform deck image or publication-style visual summary.
Does every TME visual need to match real histology?
ANot always. A data figure should stay close to the source evidence. A commercial mechanism render can be an honest abstraction as long as it clarifies the claim and avoids implying unsupported precision.
Can one visual system support several oncology programs?
AYes. A modular system can reuse tumor compartments, immune-cell styles, vessel channels and signal treatments while changing tumor type, therapeutic object or response pattern.
Next Step: Turn TME Complexity Into a Buyer-Ready Visual Story
Tumor microenvironment visualization is most useful when it turns a complex oncology system into a decision-ready story. The asset should help a buyer understand where the mechanism acts, what compartment changes, why the evidence matters and how the platform supports a therapeutic or translational claim.
Animiotics builds scientific figures, 3D renders and animation-ready systems for biotech teams that need oncology, immunology and translational biology stories with accuracy and commercial discipline. If your team is preparing a partner deck, platform launch, conference campaign or investor update, start by defining the TME claim that must be understood after the first viewing.
From there, the visual plan can turn immune contexture, stromal barriers, drug delivery and spatial biology evidence into a coherent asset system for slides, websites and motion. Open this template in Animiotics
- Align scientific, translational and commercial teams around one visual claim.
- Build modular TME assets so future oncology programs share one visual language.
- Prioritize spatial clarity and buyer comprehension before cinematic detail.