Why Organoid Model Visualization Matters
Organoid model visualization matters because organoids sit between familiar cell culture diagrams and the much messier reality of human tissue biology. A patient-derived organoid can represent architecture, heterogeneity, lineage state, microenvironment cues and treatment response in a compact model system. Those strengths are exactly what make the science hard to explain in one crowded slide.
For biotech teams, the communication problem is practical. A discovery platform may need to show why organoid models predict patient response better than flat cultures. A translational team may need to connect an assay readout to tumor architecture or tissue-specific biology. A company preparing a partner deck may need investors to understand why an organoid workflow supports target validation, biomarker selection or therapeutic positioning.
A strong organoid model visualization gives the audience a clear mental model. It shows the tissue-like structure first, then introduces the biological question, then connects model behavior to the commercial claim. The goal is not to make an organoid look decorative. The goal is to make a buyer understand what the model represents and why the evidence is decision-relevant.
- Use organoid visuals when tissue architecture, heterogeneity or response timing affect the message.
- Keep the model, assay signal and interpretation visually separate.
- Build assets that can support figures, web pages, pitch decks and animation.
Start With the Platform Claim
The first planning question is what the organoid model is supposed to prove. Some teams need to show patient relevance. Others need to explain scalable screening, co-culture biology, drug sensitivity, resistance emergence or biomarker-linked response. Each claim leads to a different visual structure. A generic cell cluster rarely carries enough meaning for a buyer to remember the point.
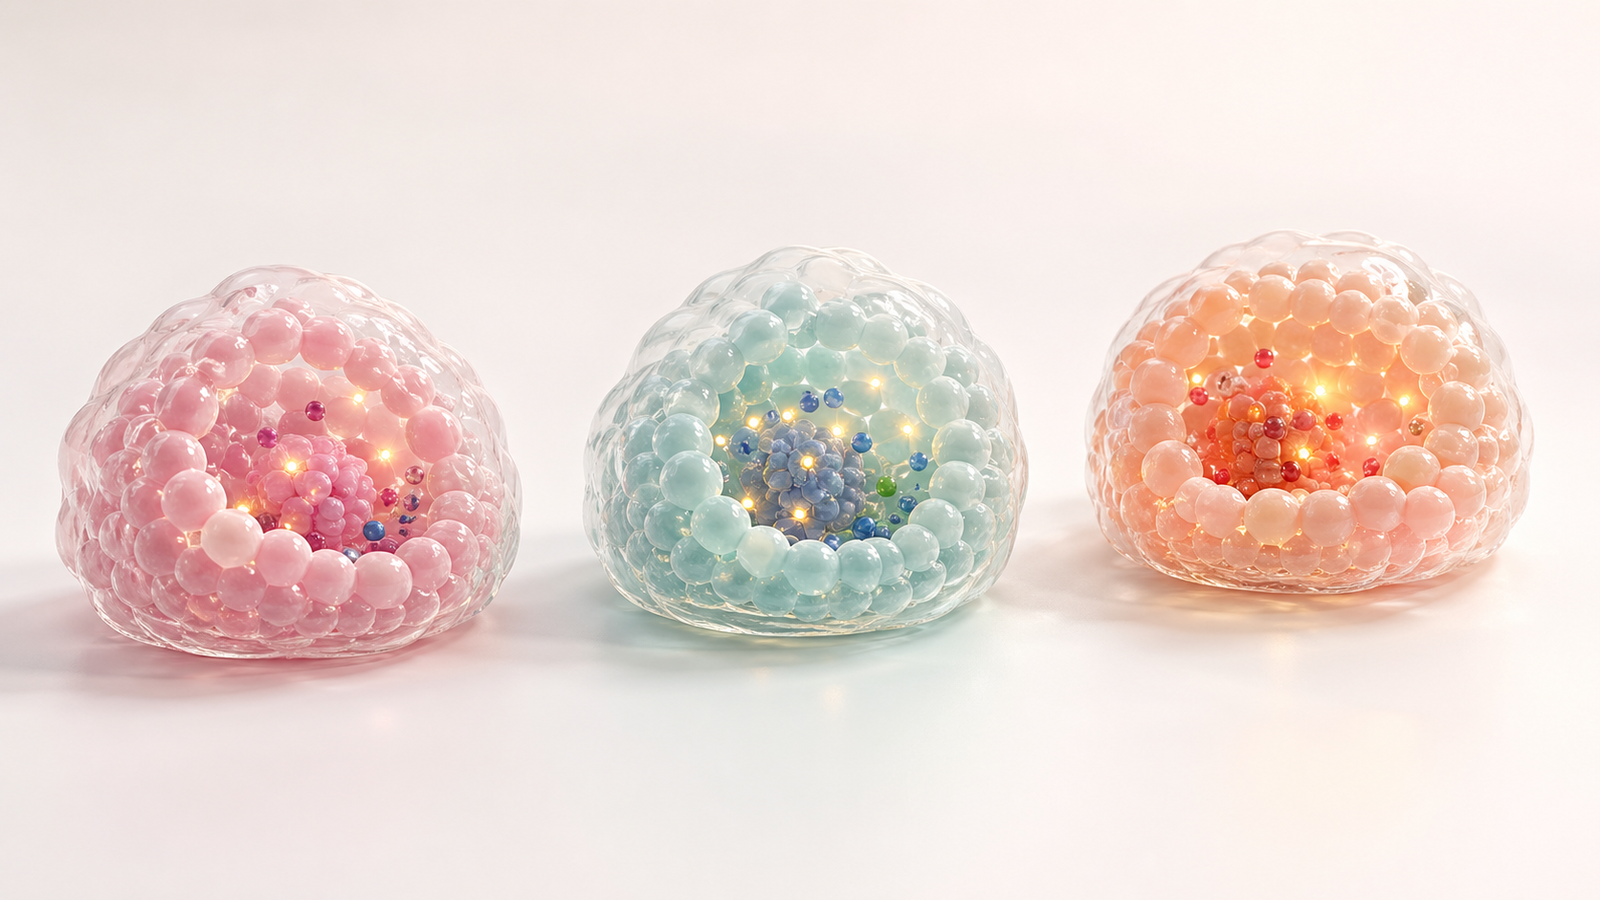
If the claim is patient relevance, the visual should make tissue origin and architecture legible without turning into a clinical diagram. If the claim is screening throughput, the visual can show multiple organoid states as a clean set of related models. If the claim is translational confidence, the storyboard should connect organoid structure to the readout that supports a decision.
This is similar to the planning discipline behind single-cell multiomics visualization. The data may be complex, but the audience needs a simple path through the evidence. Organoid model visualization should turn model architecture and response data into one coherent platform story.
- Define whether the asset sells a platform, program or research workflow.
- Choose one primary readout before adding secondary assay layers.
- Use a reusable visual system if the company works across many tissue models.
Show Tissue Architecture Before Assay Detail
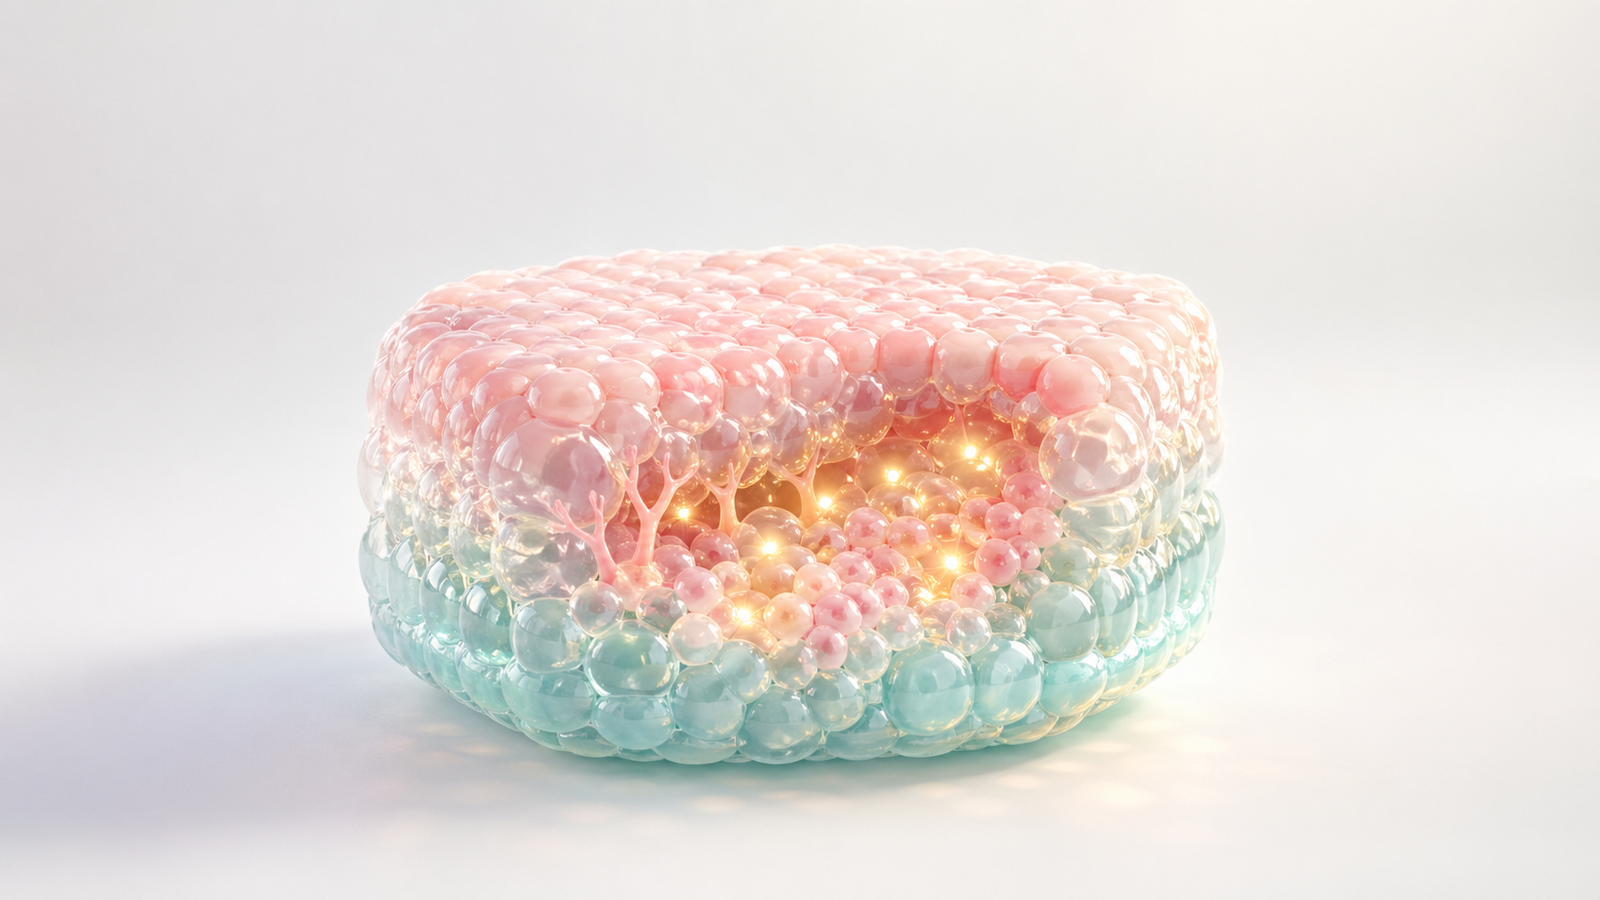
Organoids are valuable because they preserve aspects of tissue organization that flat culture cannot show. The visual should therefore start with form. A clean cutaway, translucent shell or layered tissue block can make lumen shape, cellular zones and regional heterogeneity easier to understand before the story moves into markers or treatment response.
This order matters for non-specialist audiences. If a slide opens with dozens of colored markers, the organoid becomes just another data container. If it opens with a readable structure, the assay signal has context. The viewer can understand where response occurs, why a resistant region matters or how a disease phenotype appears inside the model.
Scientific restraint is important. Organoid visuals should not imply anatomy or clinical behavior that the model does not support. A commercial render can abstract the tissue into soft layers, cell clusters and internal glows while still staying honest about the level of evidence. The abstraction should clarify the claim rather than exaggerate the model.
- Introduce the organoid as a tissue-like model before showing markers.
- Use layers, cavities and cell clusters to make architecture readable.
- Avoid implying full organ function unless the evidence supports that claim.
Visualize Drug Response as a Sequence
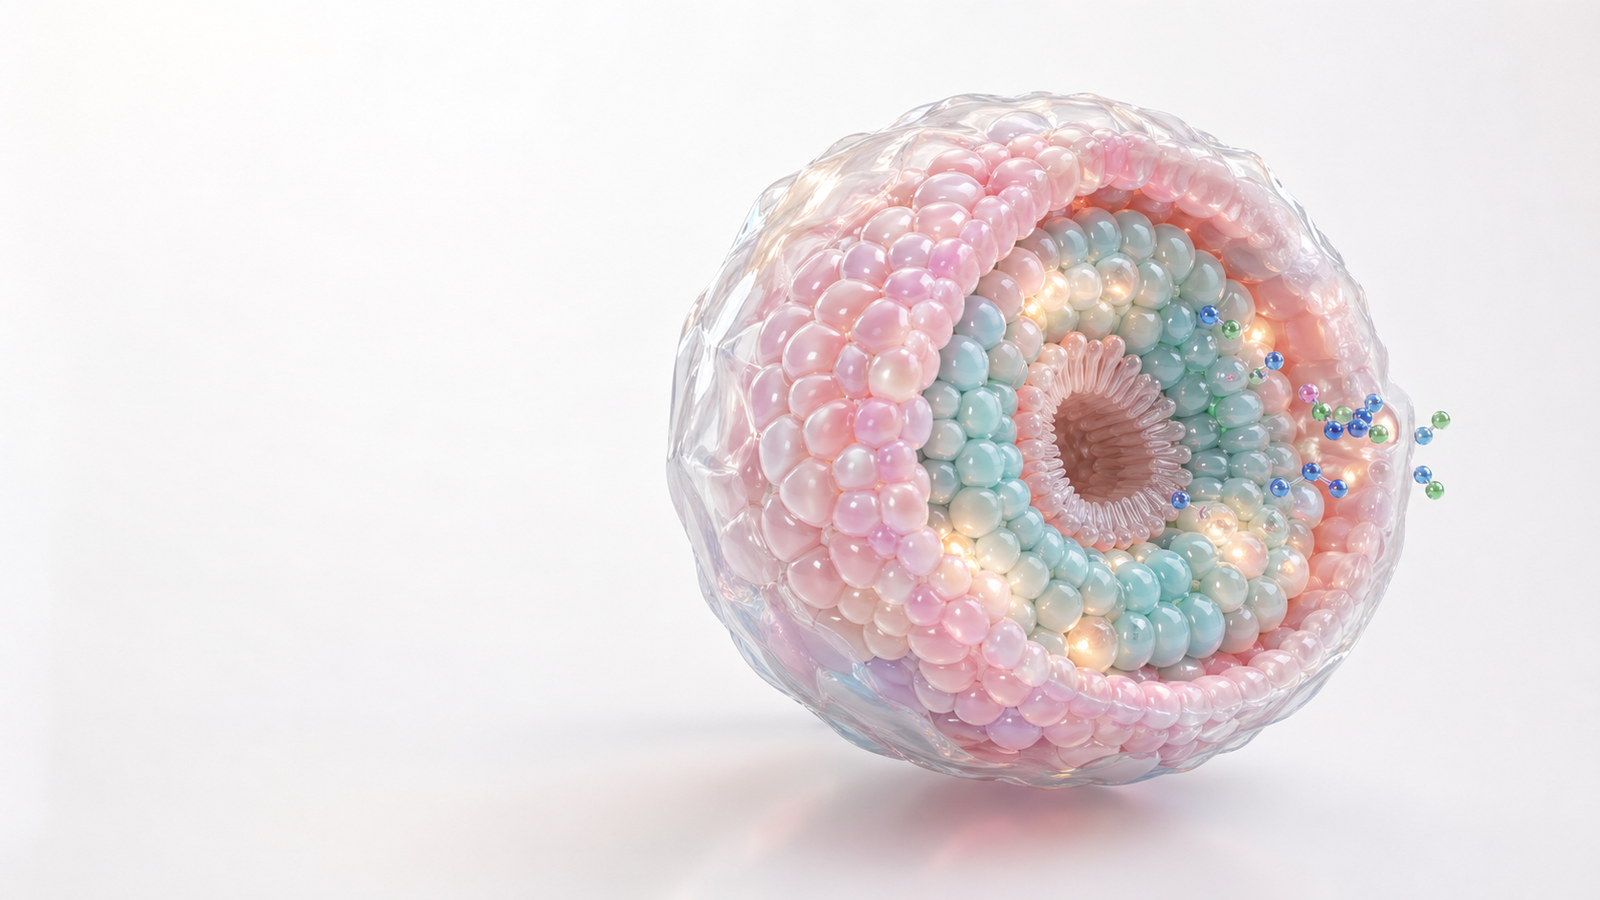
Drug response visualization is one of the strongest use cases for organoid model animation. A static endpoint image can show treated versus untreated organoids, but it often misses the causal story. Animation can show compound exposure, penetration into the model, localized response, resistant pockets and the final assay signal as separate beats.
For buyer-facing work, the sequence should stay simple. A compound enters the culture environment. A selected region of the organoid changes state. A warm signal appears where response is strongest. A secondary region remains unchanged if resistance or heterogeneity is part of the claim. This gives business development and translational teams a visual way to explain why the assay is more informative than a single viability number.
This connects directly to the ideas in our guide to antibody-drug conjugate mechanism of action animation. In both cases, the audience needs to follow exposure, mechanism and response in order. The organoid version adds spatial context that can make the evidence feel more biologically grounded.
- Break response into exposure, localization and readout.
- Use regional signal changes when heterogeneity is part of the story.
- Keep assay objects visually distinct from tissue architecture.
| Visual Beat | What It Explains | Best Use |
|---|---|---|
| Organoid baseline | The model architecture before treatment | Platform and disease model overview |
| Compound exposure | How the treatment reaches the model | Screening and pharmacology stories |
| Regional response | Where biology changes inside the organoid | Resistance, biomarker and translational claims |
Connect Organoid Evidence to Translational Decisions
The commercial value of organoid model visualization usually depends on translation. Buyers want to know how the model supports a decision about target selection, therapeutic strategy, patient segmentation or study design. The visual system should therefore connect the biological model to the specific decision the audience must make.
A translational visual can show patient-derived origin, organoid growth, assay challenge and response pattern without becoming a full clinical workflow diagram. It can also show how multiple models compare across a cohort. The important point is to avoid a generic before-after picture. The viewer should understand what decision the evidence is meant to support.
This is where organoid figures and animation can outperform standard deck slides. A table can list IC50 values or biomarker status. A clear render can show why a response pattern matters spatially. An animation can show timing and mechanism. Used together, those assets help a client explain why the platform is useful for research partners, therapeutic teams or investors.
- Tie each visual element to a decision such as target validation or patient selection.
- Use cohorts only when comparison is central to the story.
- Keep the final claim grounded in the evidence behind the model.
Build Reusable Organoid Assets for Campaigns
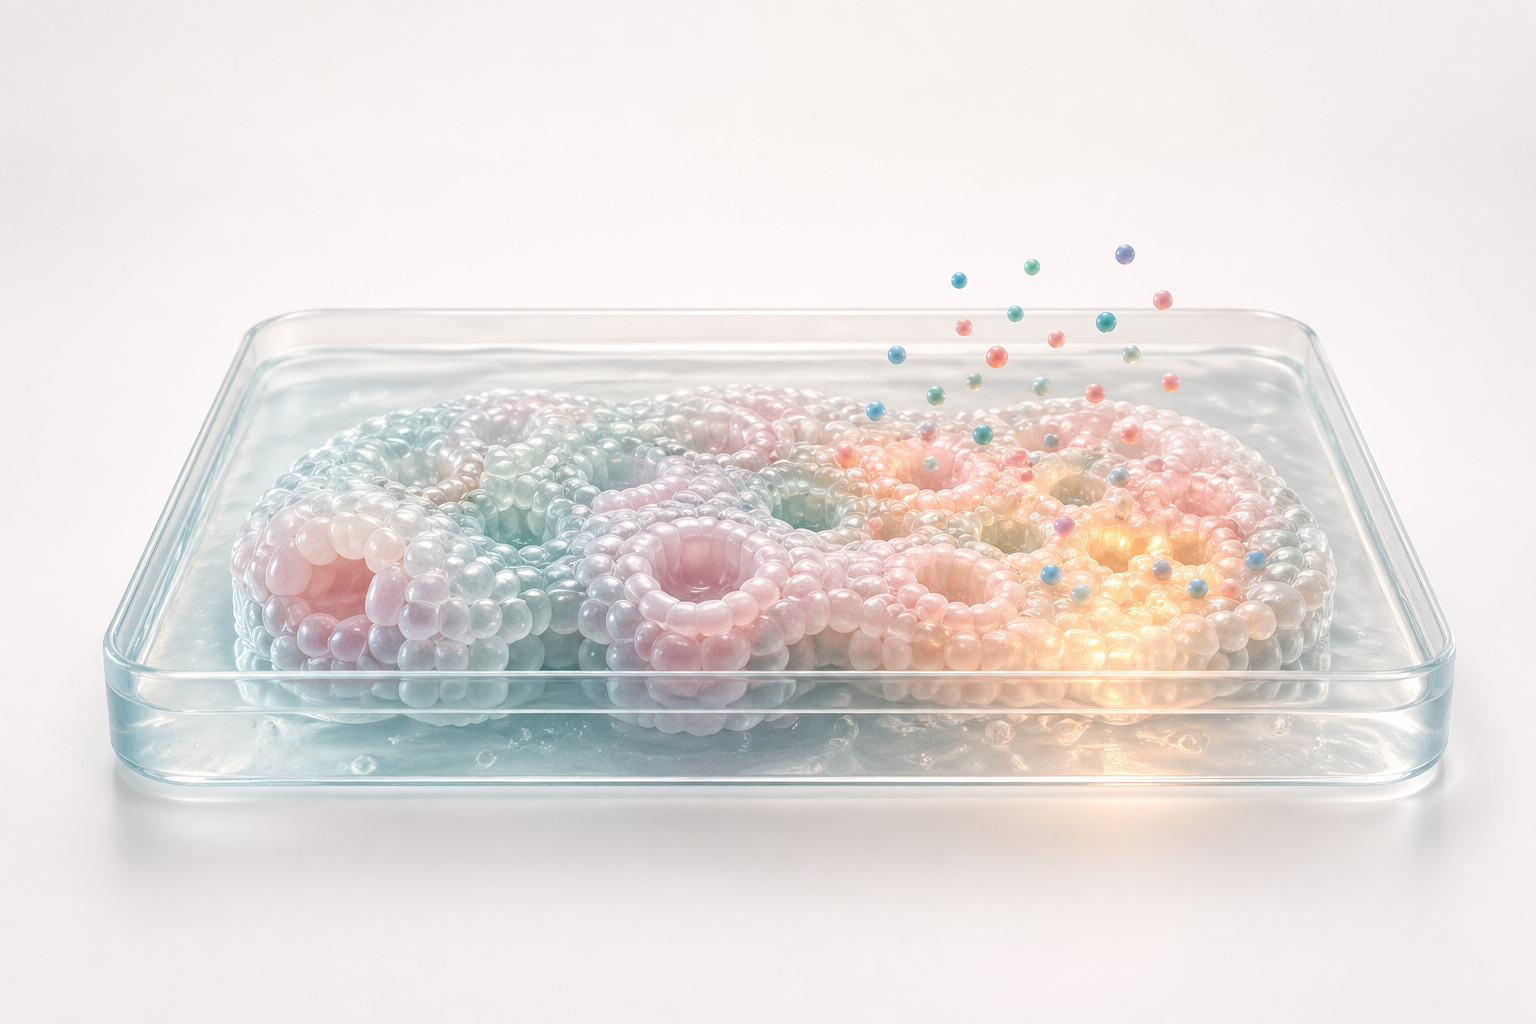
A good organoid model visualization should become more than one blog image or one presentation slide. The organoid shell, tissue layers, assay beads, culture tray, response glows and camera angles can form a reusable asset kit. That kit can support web hero images, poster figures, conference booth screens, investor decks, scientific explainers and short animation loops.
Reusable assets also make review easier. Scientific teams can approve the abstraction once, then reuse it across formats with smaller changes. Brand teams get a consistent look. Commercial teams get stills and motion assets that tell the same story in meetings, on the website and in follow-up materials. That consistency is valuable when an organoid platform has several disease areas or partner-facing use cases.
The same asset-system mindset appears in spatial transcriptomics visualization. Tissue context, signal placement and visual hierarchy should stay consistent across the campaign. Organoid model visualization benefits from the same discipline because the story depends on structure plus signal.
- Plan stills, loops and slide crops before final rendering.
- Keep tissue layers and assay signals consistent across campaign assets.
- Create modular organoid states for future programs and disease areas.
FAQ About Organoid Model Visualization
What is organoid model visualization?
AOrganoid model visualization is the process of turning organoid biology, assay workflows and response data into clear figures, 3D renders or animations for scientific and commercial communication.
When should a biotech team use organoid animation instead of a static figure?
AUse animation when timing, treatment exposure, regional response or workflow sequence affects the story. Use a static figure when the main need is a publication-ready overview or a single platform diagram.
Do organoid visuals need to show exact anatomy?
ANot always. Many commercial organoid visuals work best as honest abstractions that show tissue-like architecture and assay logic without pretending to be a full organ model.
Can one visual system cover multiple organoid programs?
AYes. A modular system can reuse culture trays, organoid shells, tissue layers and signal styles while changing disease context, treatment objects or cohort structure.
Next Step: Turn Organoid Biology Into a Clear Visual Story
Organoid model visualization is most useful when it turns a complex model system into a decision-ready story. The asset should help a buyer understand what the model represents, what signal changed, why the response matters and how the evidence supports a platform or program claim.
Animiotics builds scientific figures, 3D renders and animation-ready systems for biotech teams that need organoid, tissue model and translational biology stories with accuracy and commercial discipline. If your team is preparing a partner presentation, platform launch, conference campaign or investor update, start by defining the organoid claim that must be understood after the first viewing.
From there, the visual plan can turn patient-derived models, disease architecture, drug response and translational evidence into a coherent asset system for slides, websites and motion. Open this template in Animiotics
- Align scientific, translational and commercial teams around one storyboard.
- Build modular organoid assets so future programs share the same visual language.
- Prioritize architecture and response clarity before adding cinematic detail.