Toxicology Visualization Services For Biotech Safety Stories
Toxicology visualization services turn safety findings into a clear scientific story that a biotech audience can understand quickly. A toxicology package may include dose groups, exposure margins, organ observations, histopathology, biomarkers, recovery periods, off-target biology and risk mitigation plans. Those details are essential, but they often arrive as dense tables and long technical summaries. A focused 3D visual can show what happened, where it happened and why it matters for the program.
The commercial value is simple. Safety findings shape development decisions. Investors want to understand whether a signal is manageable. Partners want to see how the team interprets organ risk. Clinical teams need to connect nonclinical observations to dose selection, monitoring plans and patient safety. A polished toxicology render gives these groups a shared visual model without reducing the science to a generic warning icon.
For Animiotics clients, the goal is not to dramatize harm. The goal is to make safety evidence legible. That means showing one clear biological subject, a small number of supporting molecular or cellular forms and a clean explanation of the evidence pathway. The right visual can support investor updates, board materials, partnering decks, website pages, conference presentations and internal decision reviews.
Why Toxicology Findings Are Difficult To Communicate
Toxicology is hard to explain because it is both biological and contextual. A liver enzyme change, kidney biomarker shift or cardiovascular observation does not mean the same thing in every program. Teams must connect exposure, dose, time course, reversibility, organ specificity, species relevance and therapeutic window. Static slides usually show these pieces separately, which forces the audience to build the story on its own.
The problem becomes sharper when a safety signal is nuanced. A finding may be exposure related but reversible. It may appear in one species and not another. It may connect to an intended pharmacology effect or a metabolite profile. A visual system can make those distinctions visible by showing the mechanism layer, the organ layer and the decision layer as one controlled narrative.
This topic also connects to nearby development visuals without duplicating them. See https://animiotics.com/blog/preclinical-pharmacology-animation-services-how-to-explain-dose-response-biodistribution-safety-and-translational-value-clearly/ for the broader preclinical decision story. See https://animiotics.com/blog/drug-metabolism-visualization-services-how-to-explain-enzymes-metabolites-safety-and-platform-value-clearly/ for metabolism and clearance context. Dedicated toxicology visualization focuses on the safety evidence itself: what was observed, how it may arise and how the team is managing risk.
- Show the organ or cell type where the finding occurs instead of a generic risk symbol.
- Connect exposure, mechanism and biomarker evidence in a visible sequence.
- Separate observed findings from hypotheses so the story stays credible.
- Make reversibility, monitoring and mitigation easier to discuss with non-specialists.
What A Buyer-Ready Toxicology Render Should Show
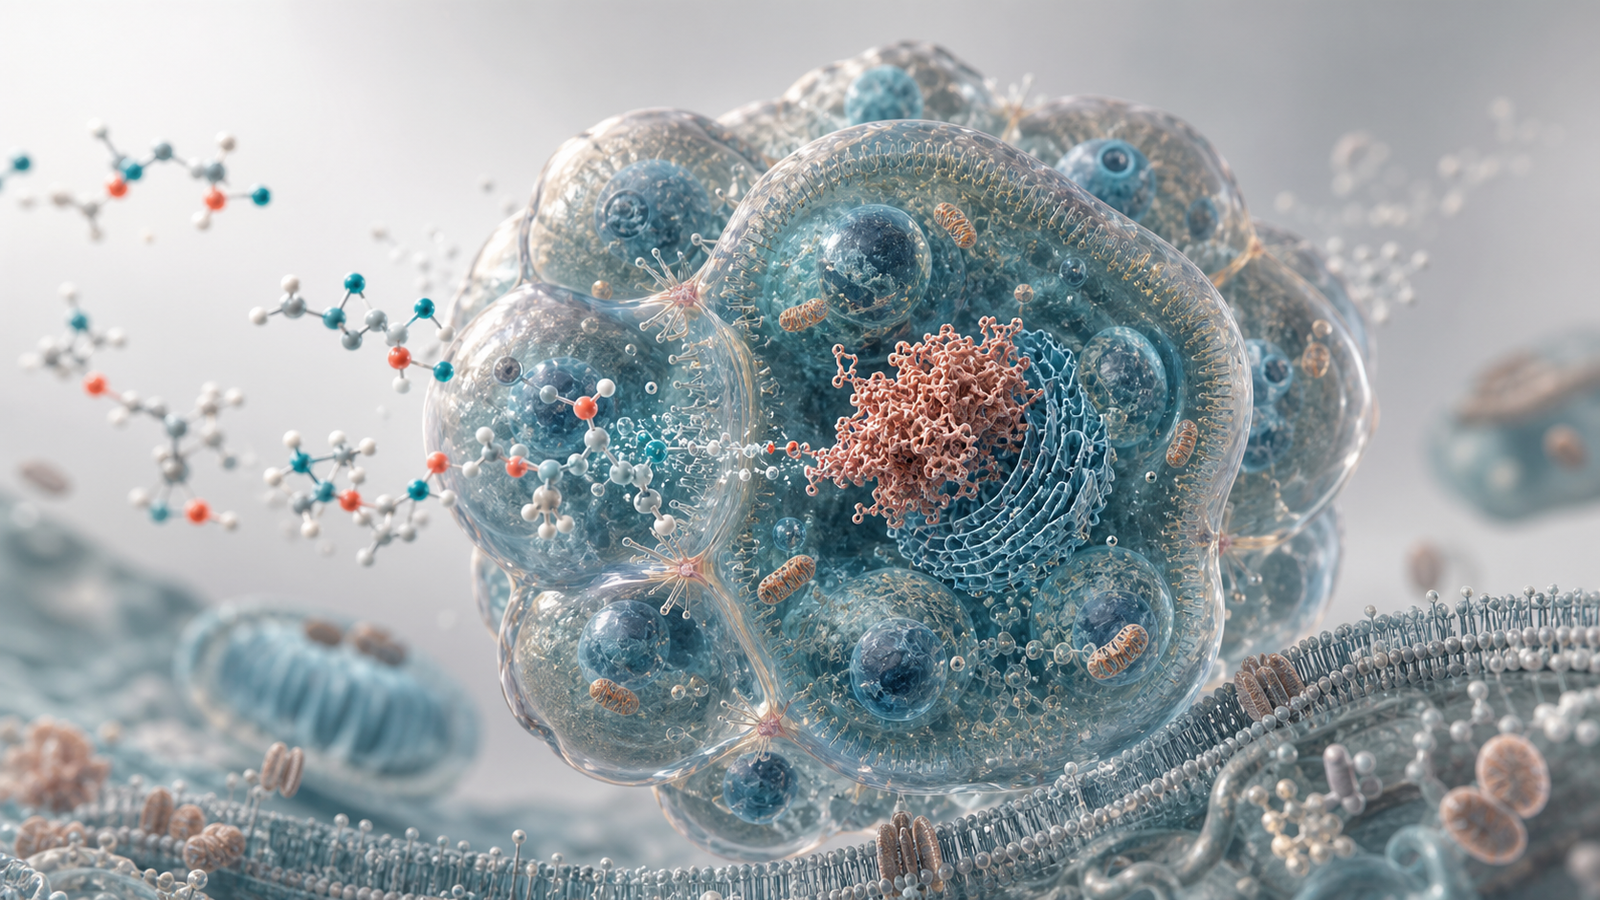
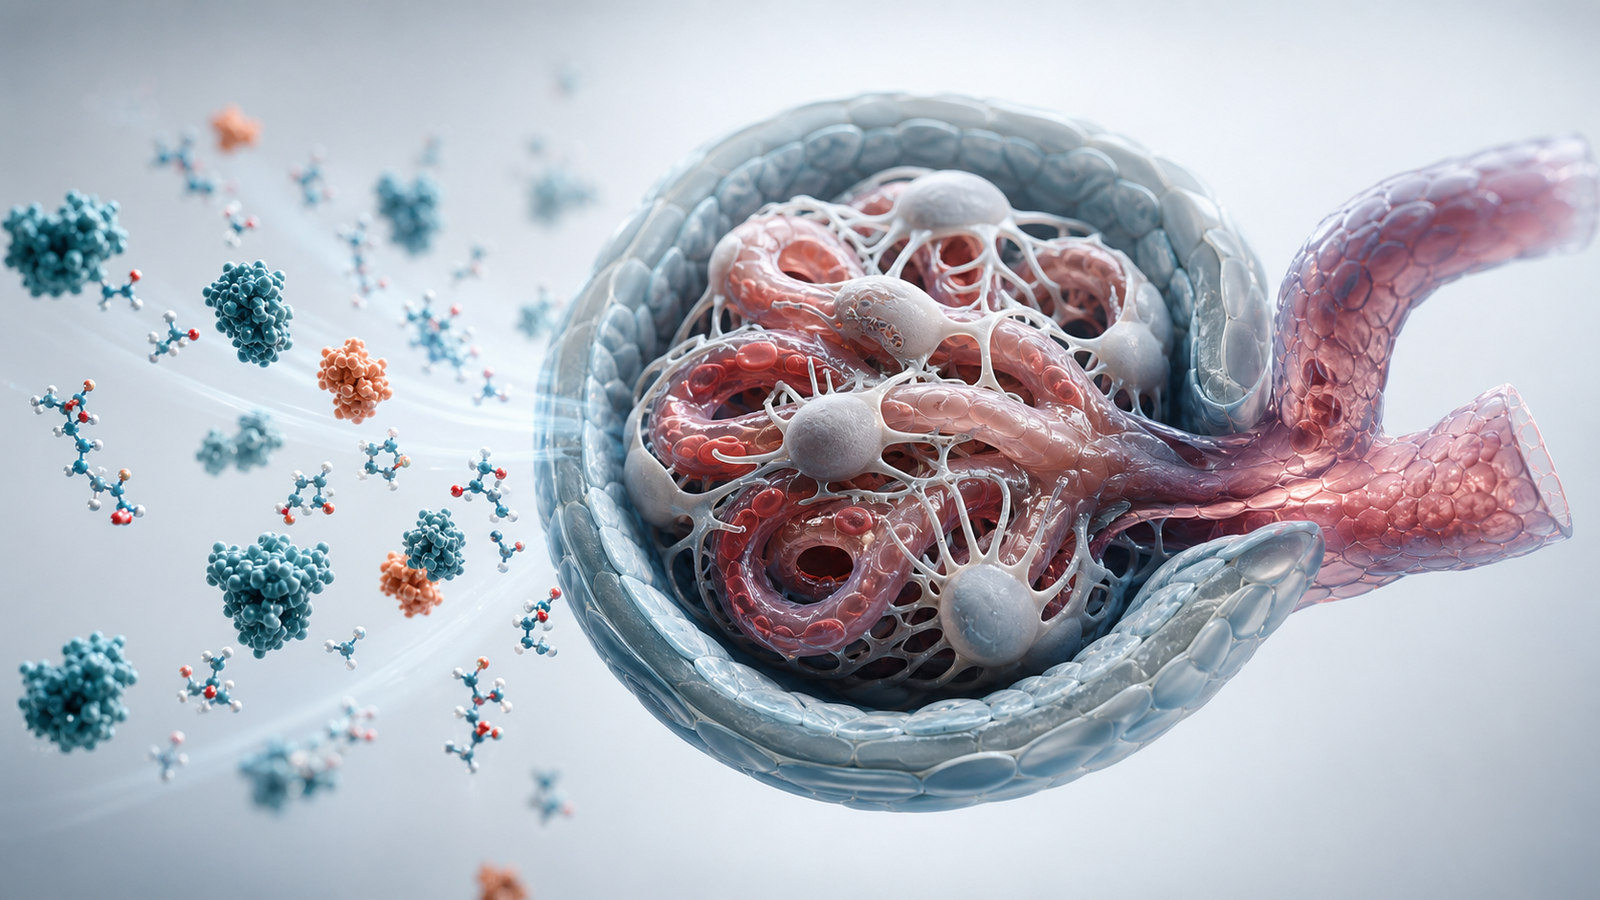
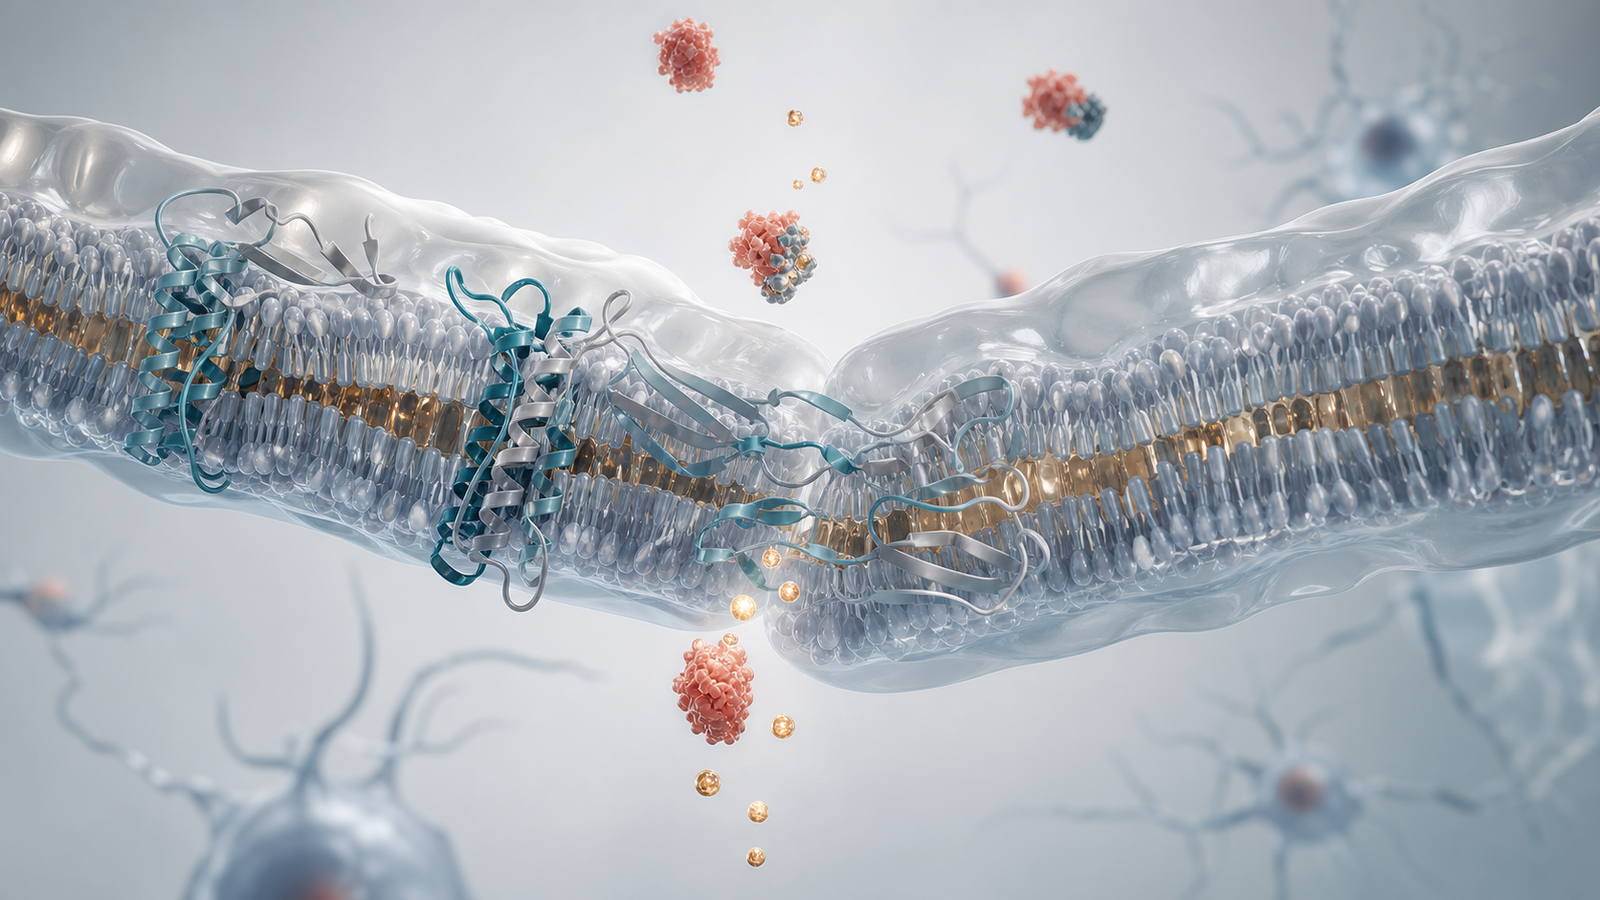
The strongest toxicology render starts with one hero subject. For a hepatotoxicity story, that may be a liver microtissue, hepatocyte membrane, mitochondrion or bile canaliculus. For a kidney story, it may be a glomerular membrane, proximal tubule cell or biomarker release scene. For a central nervous system safety question, it may be a blood-brain barrier surface, neural cell environment or receptor engagement scene. The subject should be specific enough to feel scientific, but simple enough to read in seconds.
A premium Blender or Maya style helps the visual feel serious and commercially useful. Physically plausible membranes, protein ribbons, organelles, drug molecules and biomarker proteins can communicate scientific rigor without becoming a crowded diagram. The image should avoid fake UI, labels, charts and infographic overlays. Captions and page copy can explain the details around the render while the image stays clean.
A buyer-ready render also needs restraint. If every molecule, pathway and organ system appears in the same frame, the audience sees a collage rather than a safety story. Animiotics usually builds the visual around a central organ risk or cell stress event, then adds only the supporting forms needed to explain mechanism, evidence or decision logic.
- Central subject: one organ microstructure, cell stress scene or biomolecular safety mechanism.
- Supporting forms: drug molecules, proteins, biomarkers, organelles or membranes shown sparingly.
- Material logic: translucent membranes, lab-grade molecular surfaces and polished studio lighting.
- Commercial point: explain whether the finding changes dose, monitoring, indication strategy or partner confidence.
From Mechanism To Organ Risk To Decision
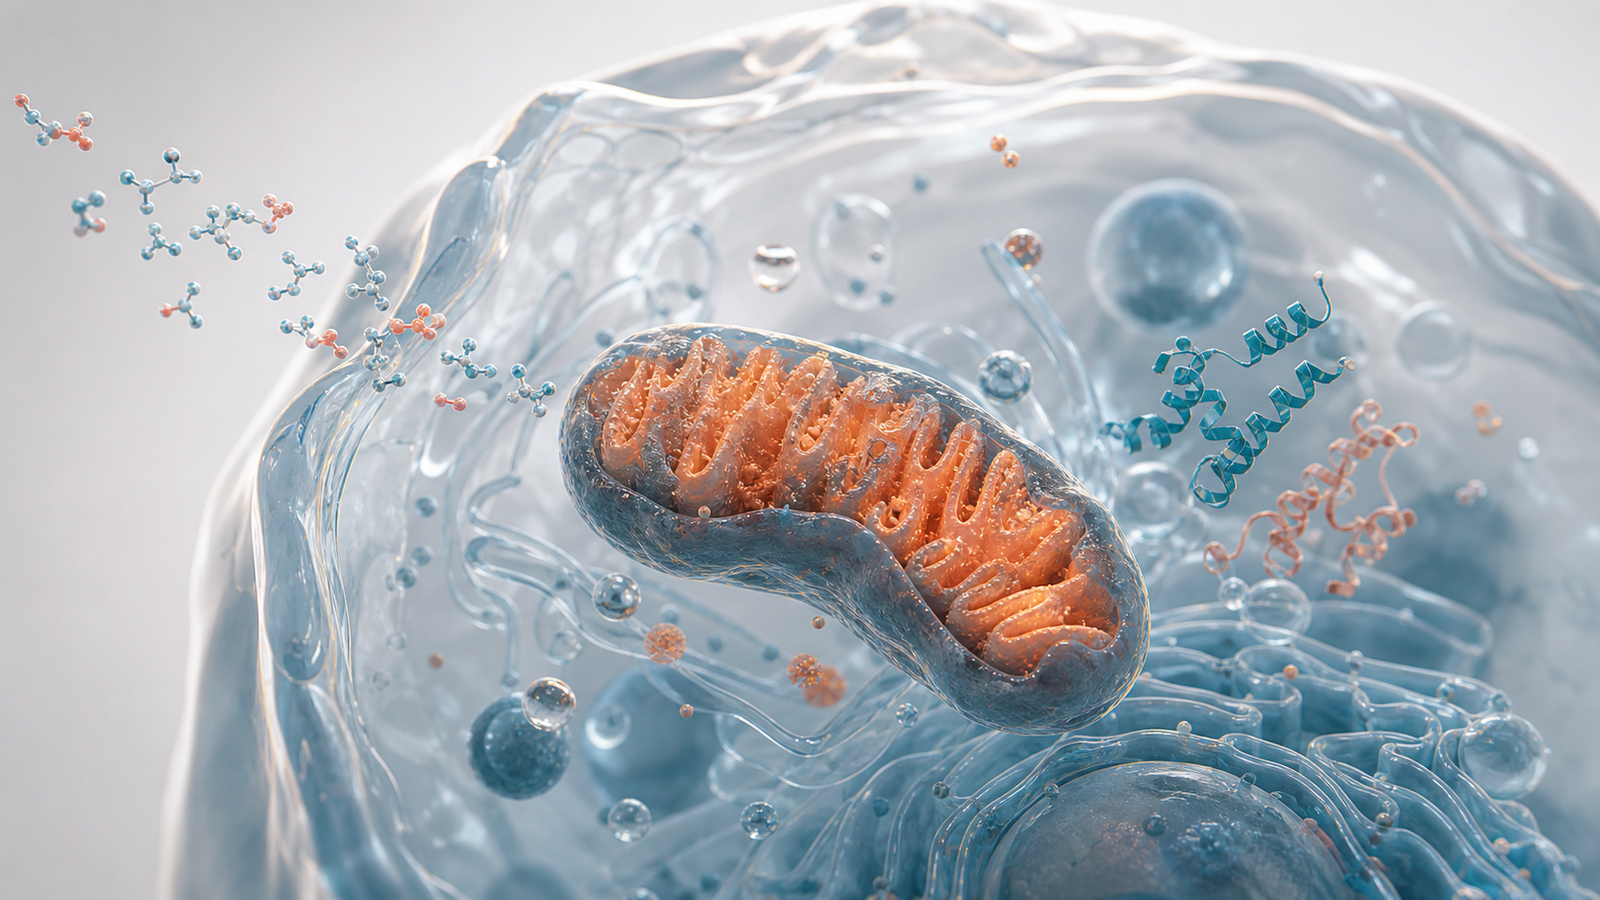
A toxicology animation works best when it follows a decision pathway. The first beat identifies the exposure context. A drug or biologic reaches a tissue at a relevant concentration. The second beat shows the local biological interaction. That may involve mitochondrial stress, receptor engagement, membrane transport, immune activation or metabolite formation. The third beat connects the local event to a measurable finding such as a biomarker shift, histology pattern or functional change.
The fourth beat should show interpretation. Is the signal on-target or off-target? Is it reversible? Is it dose limiting? Does it appear only above the intended exposure range? Does it require clinical monitoring or a chemistry change? A visual cannot answer every regulatory question, but it can make the reasoning path easier to follow.
This sequence is especially useful for platform companies. A platform may generate several candidates with shared delivery chemistry, target biology or tissue distribution. Toxicology visualization can show how the team evaluates safety across the platform rather than treating each finding as an isolated event.
| Safety Story Layer | Visual Focus | Buyer Question | Animation Purpose |
|---|---|---|---|
| Exposure | Drug or modality reaching the tissue | Is the finding connected to relevant exposure | Set the context before showing biology |
| Mechanism | Cell stress, receptor engagement or metabolite effect | What may be driving the observation | Make the hypothesis visible without overclaiming |
| Organ risk | Liver, kidney, cardiovascular, immune or CNS microstructure | Which system is affected | Anchor the signal in a recognizable biological site |
| Evidence | Biomarker, histology or functional readout | What supports the interpretation | Connect visual mechanism to measured data |
| Decision | Dose change, monitoring plan or candidate selection | How does the team manage risk | Tie the science to development action |
How Visuals Support Safety Reviews And Partner Discussions
Toxicology visualization can help safety reviews move faster because it gives the team a common map. Toxicologists, pharmacologists, chemists, program leaders and business development teams often use different language for the same risk. A clean visual connects those perspectives. It can show where a finding sits in the body, which mechanism is being considered and what evidence supports the next decision.
For partner discussions, this can be the difference between a defensive explanation and a confident one. A partner does not need every table from the study report in a first meeting. The partner needs to understand whether the team has a disciplined view of the signal. A render or short animation can frame the finding before the technical appendix handles the details.
For investors, toxicology visuals should avoid hype. A safety signal is serious. The visual should make the team look rigorous rather than dismissive. That means showing the biology clearly, acknowledging uncertainty and explaining how the program is using evidence to protect the therapeutic window.
- Board updates: explain the finding and action plan without overwhelming the room.
- BD decks: show that the team understands organ risk and mechanism uncertainty.
- Clinical planning: connect nonclinical findings to monitoring and dose rationale.
- Platform marketing: demonstrate mature safety thinking around a modality or delivery system.
Scientific Accuracy Checks Before Rendering
Before final production, the team should define exactly what the image is allowed to imply. Subject matter experts should review species, tissue, dose context, route of administration, exposure range, time course, reversibility, biomarker evidence and the level of confidence around mechanism. This review prevents a beautiful render from turning a hypothesis into an unsupported claim.
The most important accuracy decision is often visual hierarchy. If a scene shows too much cellular damage, it can imply a severe finding that the data do not support. If it looks too clean, it can understate a real risk. The best toxicology render usually sits between those extremes. It shows the relevant biological stress or organ context with enough restraint to stay credible.
A useful production checklist starts with the audience. A toxicology review committee may need a more technical sequence than an investor update. A website page may need a single hero render that introduces the capability without showing proprietary data. A partnering deck may need a mechanism scene paired with a separate evidence slide. The same visual system can support all of these outputs when the scientific boundaries are defined early.
- Confirm organ system, cell type, modality and exposure context before art direction.
- Separate measured findings from proposed mechanism in narration and captions.
- Avoid unsupported claims about safety margin, reversibility, class effect or clinical risk.
- Use external captions and copy for data instead of fake labels inside the render.
- Keep the scene clean enough that the viewer can identify the main safety question immediately.
FAQ About Toxicology Visualization Services
What should toxicology visualization services include?
AThey should include the relevant organ or cell type, the likely biological interaction, the measured evidence and the development decision the team needs to explain. The exact scope depends on whether the asset is for an internal review, investor update, partner deck, website page or conference presentation.
Can toxicology visuals be used when the mechanism is not proven?
AYes, if the story is framed carefully. The visual can show a proposed mechanism, competing hypotheses or an evidence pathway without implying certainty. The caption and narration should make the confidence level clear.
How technical should the render be?
AA scientific review may need organ-specific detail, study context and evidence layers. A buyer-facing page usually needs one polished render that makes the safety question tangible. Animiotics can build a visual system that starts simple and expands into more technical sequences when needed.
Does this replace toxicology tables or study reports?
ANo. It complements them. Tables and reports remain the source of record. Visualization helps teams explain time, location, mechanism and decision logic so the supporting data can be understood faster.
CTA: Build A Clear Safety Evidence Story
If safety findings are central to your program story, they should not be trapped in a dense appendix. Animiotics can help turn toxicology findings, organ risk, biomarker evidence and translational decisions into polished 3D visuals built for biotech buyers, partners, investors and internal teams.
Start with the question your audience needs answered: what happened, where did it happen and what is the team doing about it? From there, the visual can focus on the organ, mechanism, evidence and decision logic that make the safety story credible.