Why Drug Metabolism Visualization Services Matter
Drug metabolism visualization services turn a dense DMPK story into evidence that buyers, partners and internal decision makers can understand quickly. A development team may be working with CYP isoforms, phase II conjugation, active metabolites, clearance routes, transporter effects and species translation. The commercial audience usually needs a clearer answer: what happens to the molecule after dosing, what risks are controlled and why does the platform deserve confidence?
Metabolism can decide whether a program looks developable. A promising molecule can lose momentum when reviewers cannot connect potency to exposure, half-life, metabolite burden, drug interaction risk or safety margin. A clear 3D render or animation can show the parent compound entering the liver, meeting the relevant enzyme pocket, forming a metabolite and moving toward clearance without forcing the audience to decode disconnected charts.
Animiotics builds drug metabolism visuals for biotech and pharma teams that need to explain DMPK findings on websites, investor decks, partner presentations, conference loops, scientific posters and business development materials. The aim is not to decorate a metabolism slide. The aim is to make the mechanism and evidence legible enough that a buyer understands the platform value before the technical appendix begins.
- Use visualization when metabolism data is central to developability, safety or platform differentiation.
- Show the parent drug, enzyme environment, metabolite and clearance route as one coherent story.
- Connect DMPK evidence to buyer concerns such as exposure, DDI risk, toxic metabolites and translational confidence.
What Buyers Need To See In A Metabolism Story
Drug metabolism data can be technically strong yet commercially unclear. A buyer may see intrinsic clearance values, microsomal stability, hepatocyte data, metabolite ID tables and CYP inhibition results without understanding which result matters most. Drug metabolism visualization helps organize that evidence into a sequence: absorption into circulation, liver exposure, enzyme binding, chemical transformation, metabolite fate and safety interpretation.
The strongest visuals avoid showing every pathway at once. Instead, they identify the decision point. Does the molecule avoid rapid oxidation? Is the major metabolite inactive and well tolerated? Does the platform reduce CYP3A4 liability? Is the clearance route predictable enough to support dose planning? A focused visual hierarchy lets the audience see those answers without a crowded pathway map.
Metabolism stories also need scientific restraint. A useful render can represent a CYP enzyme pocket, a smooth hepatocyte surface, a parent compound and a metabolite transition, but it should not pretend that unknown pathways are proven. When uncertainty exists, the visual can still be commercially useful by distinguishing established evidence from strategic interpretation in the script, caption and surrounding article copy.
- Parent compound: show the starting molecule as the focal subject.
- Enzyme logic: show the relevant CYP, UGT or esterase context without clutter.
- Metabolite fate: show whether transformation supports clearance, activity or risk.
- Buyer value: link the mechanism to safety margin, dosing confidence or platform selectivity.
CYP Enzyme Animation For Mechanism And DDI Risk
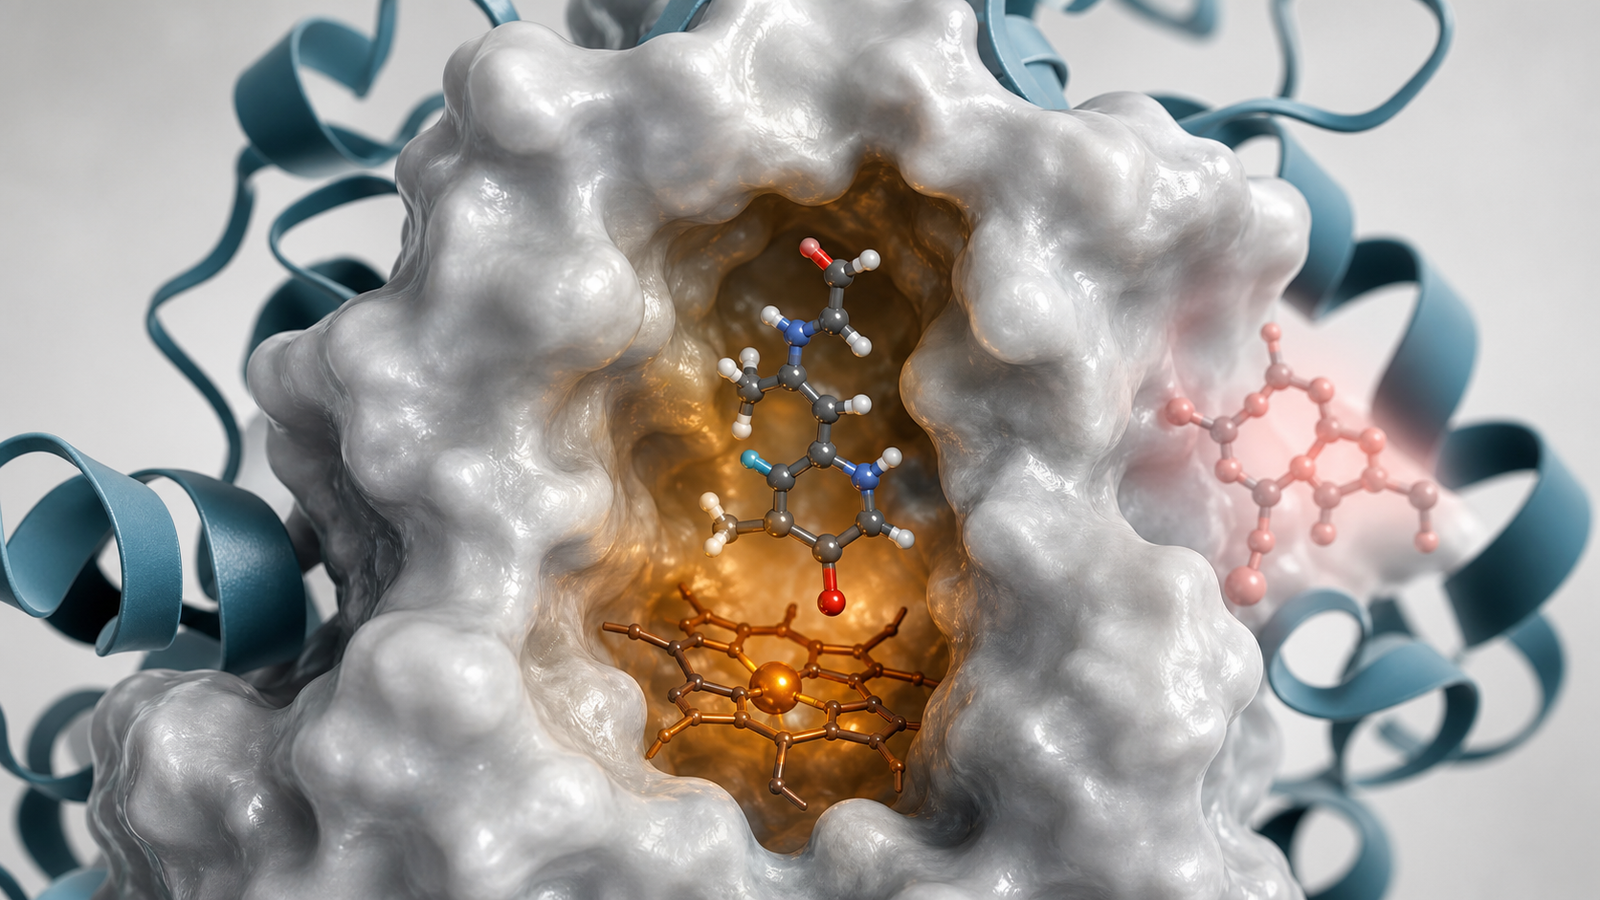
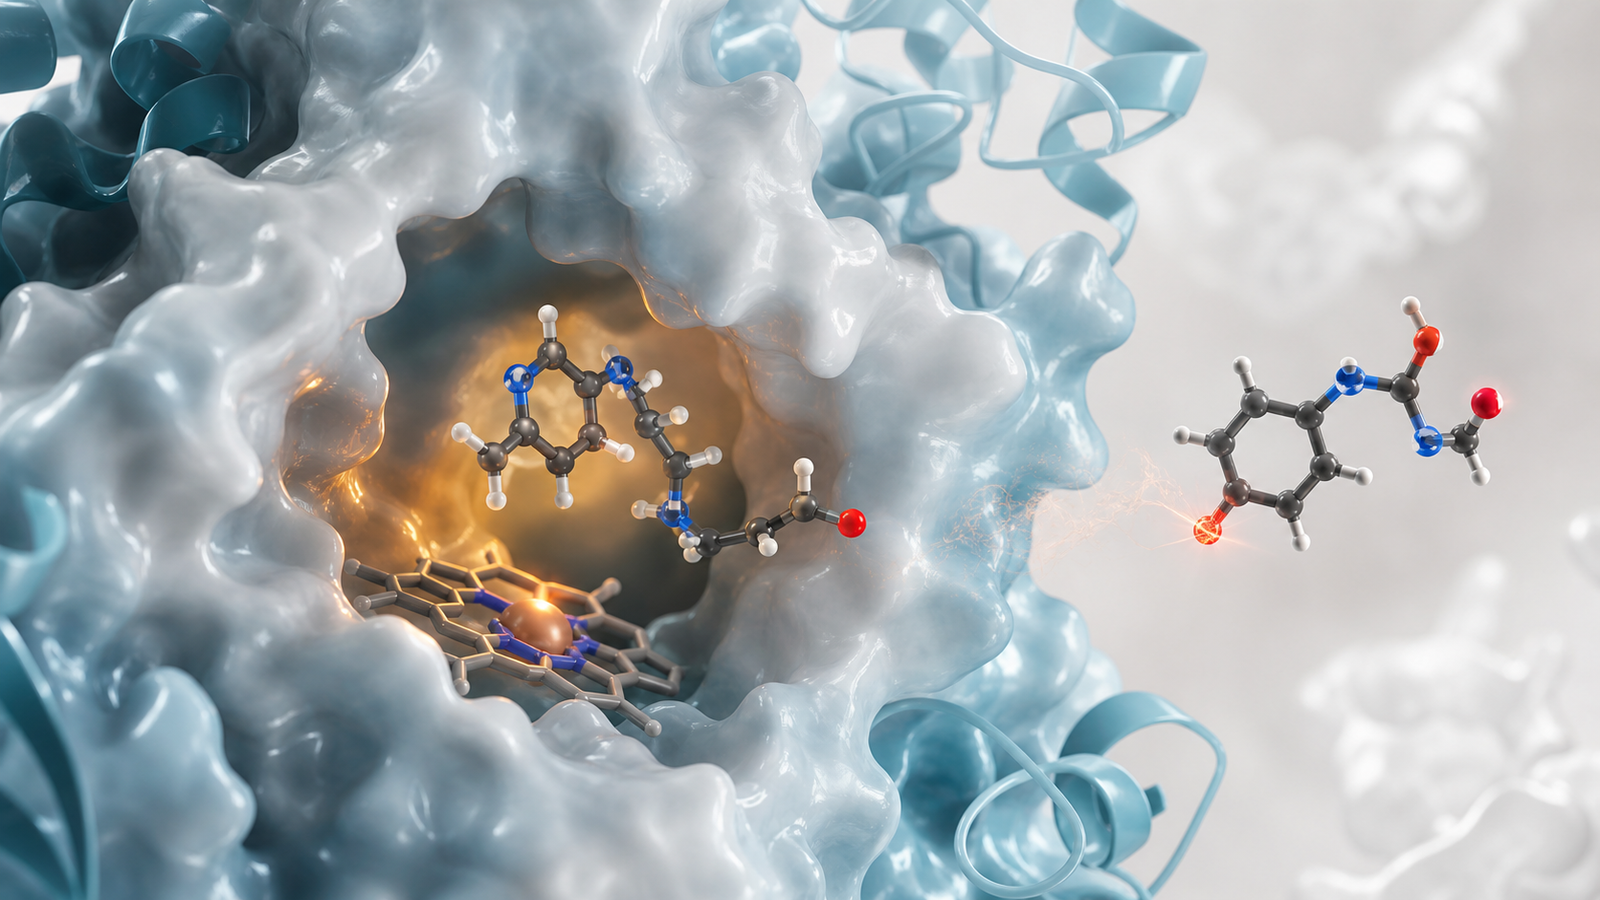
CYP enzyme animation is especially useful when a program must explain how a compound is metabolized or why it avoids a known interaction liability. Static tables can show CYP inhibition or induction results, but they rarely make the risk intuitive. A 3D scene can show the substrate entering a heme-containing enzyme pocket, orienting near the active site and producing a defined metabolite while keeping the composition clean and credible.
For discovery and translational teams, CYP visuals can clarify why a chemical series was optimized away from a liability. For platform companies, they can show how design rules reduce metabolism risk across a pipeline. For business development teams, they can give partners a fast mental model of DDI risk without oversimplifying the evidence.
The visual should be built around one enzyme story at a time. A central CYP pocket, one parent compound and one metabolite transition are usually more effective than a web of isoforms. If the article or deck also needs broader ADME context, link the scene to a related service article such as https://animiotics.com/blog/pharmacokinetic-visualization-services-how-to-explain-adme-exposure-dose-and-platform-value-clearly/ so readers can continue into exposure and dose logic.
- Show the enzyme pocket as a physical environment rather than an abstract icon.
- Use the metabolite transition to explain mechanism, liability or optimization strategy.
- Avoid fake charts, labels or pathway overlays inside the render.
| Metabolism question | Visual focus | Commercial value |
|---|---|---|
| Which enzyme handles the compound? | CYP pocket with one bound substrate | Clarifies dominant pathway and DDI relevance |
| Why did chemistry optimize this series? | Parent compound shifting away from a liability-prone pose | Shows design rationale without heavy medicinal chemistry detail |
| Is the metabolite acceptable? | Metabolite leaving the active site toward clearance | Connects transformation to safety and developability |
| Can the platform scale? | Reusable enzyme and compound visual language | Makes a pipeline story feel consistent across programs |
Metabolite Pathway Visualization For Safety And Clearance
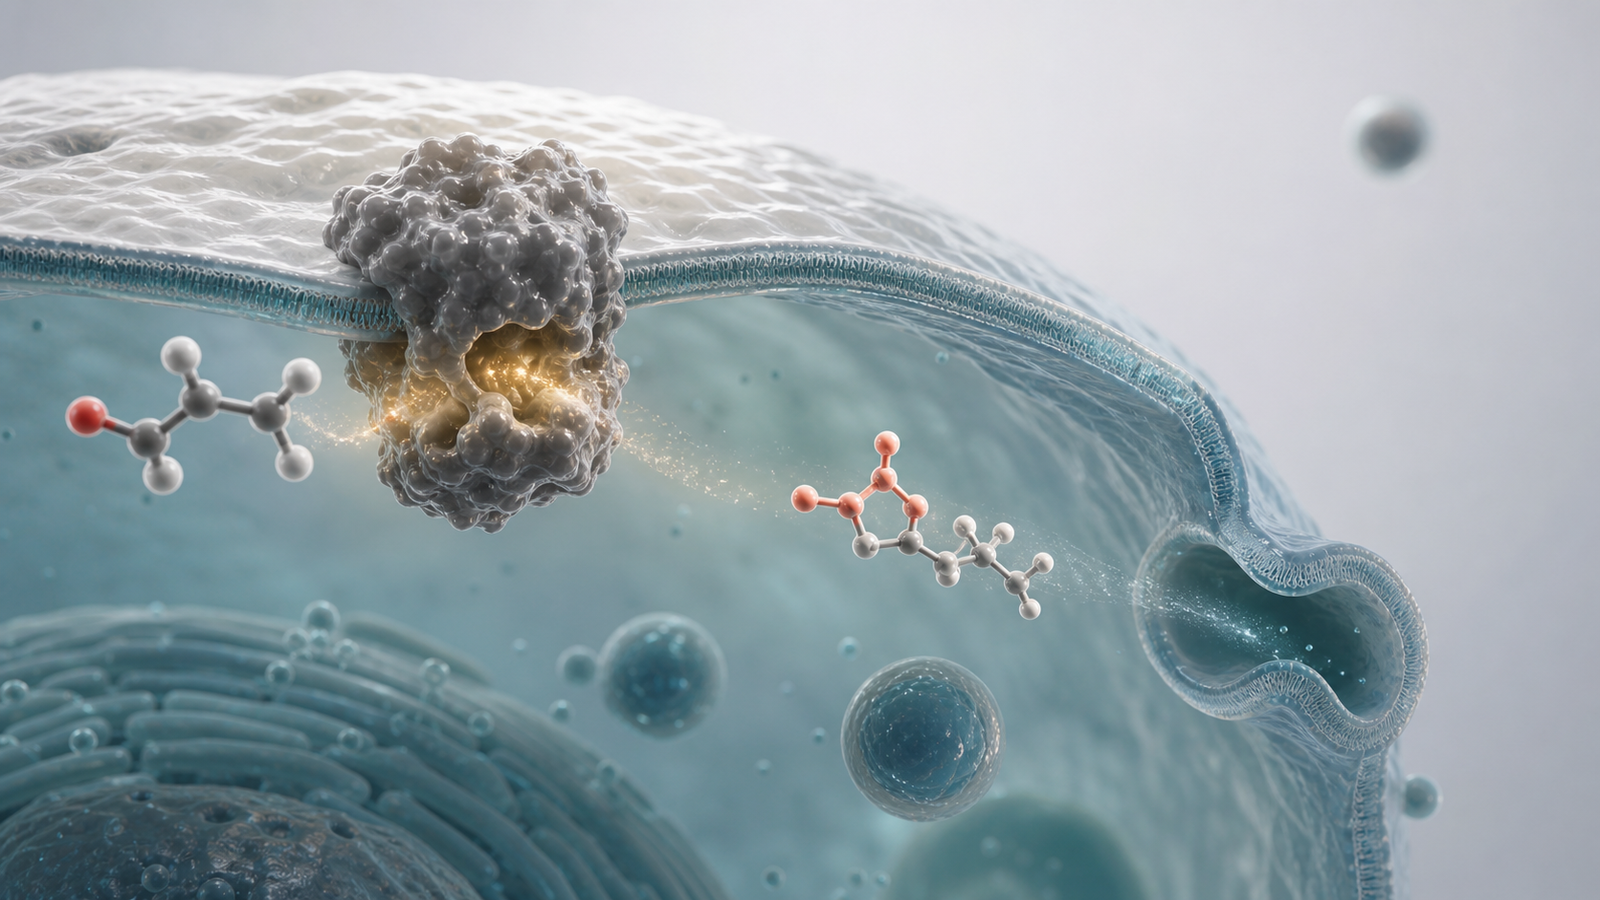
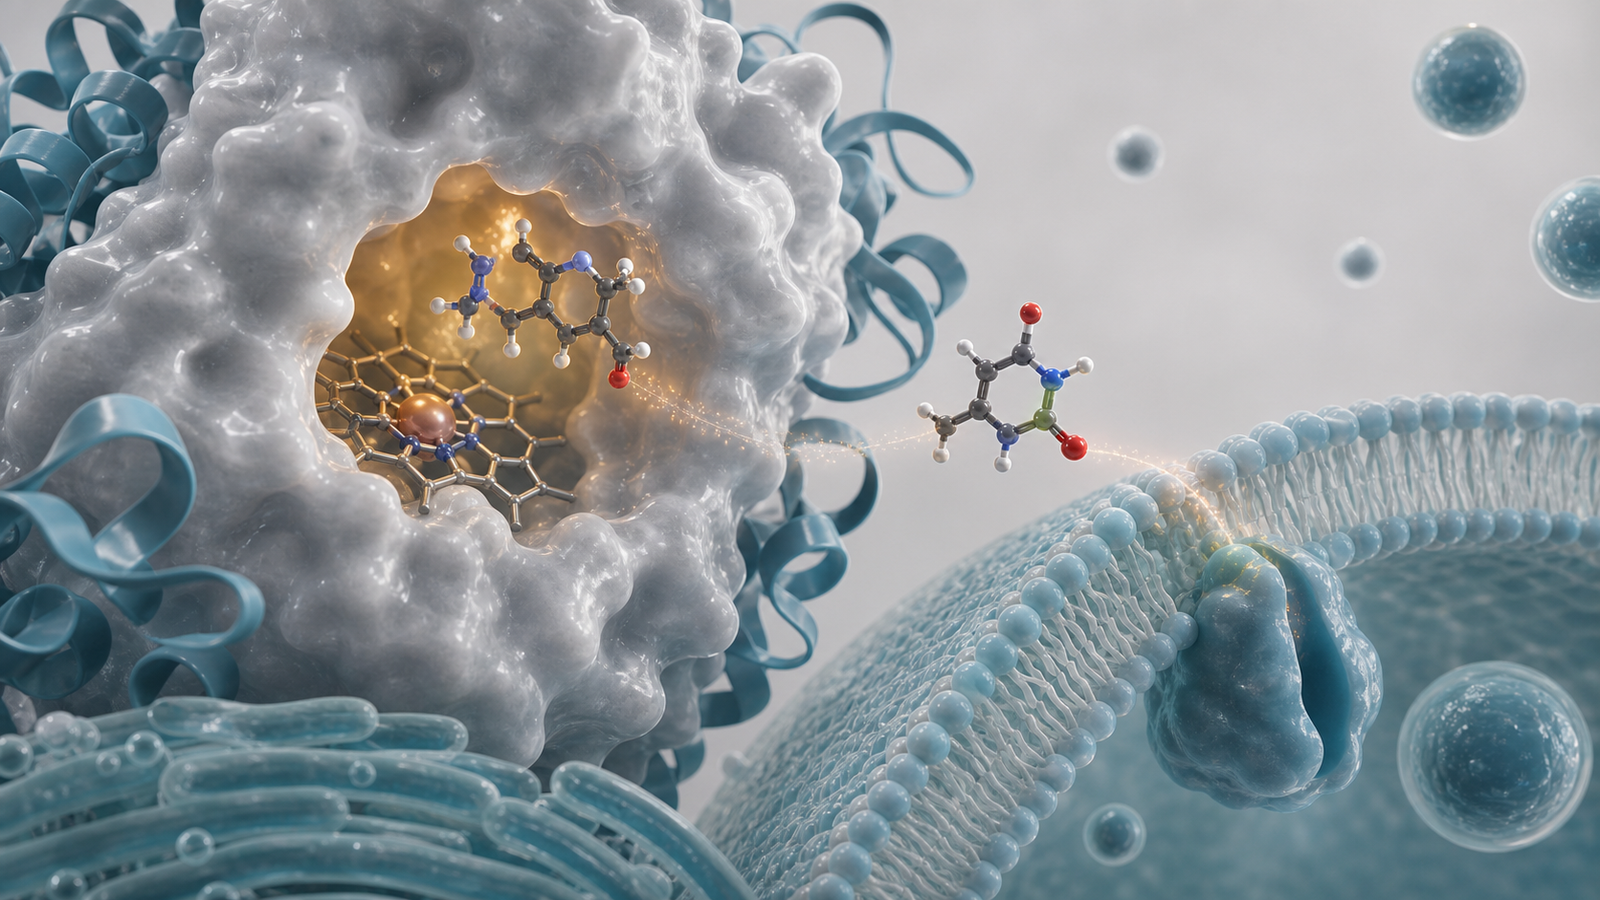
Metabolite pathway visualization helps teams explain what happens after the first transformation. The buyer may need to understand whether a metabolite is active, inactive, reactive, conjugated, excreted or still under investigation. A clean visual can show the metabolite moving from enzyme surface to hepatocyte context, then toward bile, kidney or circulation depending on the evidence.
This matters when safety is part of the value proposition. A platform may claim cleaner metabolites, reduced reactive intermediate risk, better half-life tuning or improved translation from preclinical species. Those claims are easier to evaluate when the viewer can see the pathway logic rather than reading a dense paragraph of assay outputs.
A strong metabolite visual uses one clear biochemical route and a small number of supporting forms. The scene might include a liver cell membrane, a smooth enzyme surface, a parent molecule and a metabolite with subtly different geometry. It should not become an infographic. For visual systems that need to connect molecular evidence to broader launch material, pair this approach with https://animiotics.com/blog/biotech-product-launch-animation-services-how-to-turn-new-science-into-a-buyer-ready-campaign/.
- Use spatial flow to show parent drug, transformation, metabolite and clearance.
- Make safety relevance explicit in the surrounding copy and caption.
- Keep the render minimal enough that the metabolite remains readable.
How To Turn DMPK Data Into Buyer Ready Visual Assets
A buyer-ready metabolism visual starts with a clear claim. The claim might be that a lead molecule has acceptable metabolic stability, that the main metabolite is benign, that DDI risk is lower than expected or that a design platform can tune clearance. Once the claim is defined, the visual system can choose the right level of detail: molecular render, hepatocyte scene, pathway animation or deck-ready mechanism sequence.
The production workflow should separate evidence from interpretation. Teams usually provide assay context, compound class, relevant enzyme data, known metabolite identities, clearance route, safety concern and audience. Animiotics translates that information into a visual script, a 3D scene plan and still or animated assets that can be reused across a website, investor deck, sales conversation and technical presentation.
This is where scientific accuracy and commercial clarity meet. Too much detail makes the asset unusable for top-of-funnel buyers. Too little detail makes it feel generic. The best drug metabolism visualization services create a visual hierarchy that lets the science team approve the mechanism while giving commercial teams a clean story they can actually use.
- Start with the business decision the metabolism evidence supports.
- Choose one hero subject for each render: enzyme pocket, hepatocyte membrane, metabolite route or platform comparison.
- Build assets in a consistent 3D language so the platform story scales beyond one slide.
| Input from the science team | Asset decision | Output for buyers |
|---|---|---|
| Metabolic stability data | Show controlled residence and slower transformation | Clear developability story |
| CYP inhibition or induction result | Show enzyme interaction with restrained visual emphasis | Readable DDI risk explanation |
| Metabolite ID package | Show parent to metabolite transition | Confidence in metabolite fate |
| Platform design rule | Reuse molecular style across compounds | Scalable pipeline communication |
Where Drug Metabolism Visuals Fit In The Biotech Funnel
Drug metabolism visuals can support more than one stage of the buyer journey. At the awareness stage, a clean hero render can make a platform feel sophisticated and understandable. In investor materials, a short mechanism sequence can show why the molecule is developable. In partner conversations, a more technical asset can connect enzyme data, metabolite identity and safety interpretation.
The same core scene can often be adapted into multiple formats. A cover render can introduce the platform. A section render can focus on CYP mechanism. Another can show metabolite clearance. A final asset can show how the visual language supports a repeatable DMPK evidence system. This makes the investment in 3D scientific rendering more useful than a one-off image.
For biotech teams selling a platform, this matters because buyers rarely purchase a single data point. They buy confidence that the platform can produce programs with understandable mechanisms, manageable risk and convincing translational logic. A good metabolism visual system helps that confidence form faster.
- Website: use a wide hero render that makes the platform topic instantly recognizable.
- Investor deck: use a short sequence that connects DMPK data to developability.
- Partner pitch: use more technical stills that explain enzyme, metabolite and safety evidence.
- Sales enablement: reuse approved assets so the story stays consistent across teams.
FAQ: Drug Metabolism Visualization Services
What are drug metabolism visualization services?
AThey are scientific rendering and animation services that explain how a drug is transformed by enzymes, how metabolites form, how clearance works and how DMPK evidence supports safety or platform value.
When should a biotech company use metabolism visuals?
AUse them when metabolism, clearance, metabolite identity, DDI risk or DMPK strategy is important to investor confidence, partner evaluation, website messaging or sales education.
Can visuals explain CYP enzymes without becoming misleading?
AYes, if the scene is scoped around known evidence and avoids decorative pathway claims. A focused CYP enzyme animation can show substrate binding, active-site orientation and metabolite formation while the surrounding copy handles the data limits.
What makes Animiotics different from a generic scientific illustration vendor?
AAnimiotics builds buyer-ready 3D visuals for biotech platform communication, so the work is designed around mechanism clarity, commercial use, reusable assets and scientific credibility rather than one isolated graphic.
Ready To Build A Clear Drug Metabolism Visual Story
Drug metabolism visualization services are most valuable when the science is important but the current story is fragmented across assay tables, chemistry notes and technical slides. Animiotics can turn that evidence into a premium 3D visual system that explains enzymes, metabolites, clearance, DDI risk and platform value in a way buyers can follow.
Start with Animiotics when your team needs drug metabolism renders, CYP enzyme animation, metabolite pathway visuals or a broader DMPK communication system for a biotech website, investor deck, launch campaign or partner presentation.
- Bring the key claim, the relevant DMPK evidence and the audience you need to persuade.
- Use the first asset to clarify one metabolism decision point, then scale the visual system across the funnel.
- Keep the visuals premium, restrained and scientifically useful so the platform story feels credible.