Why Immunofluorescence Assay Visualization Services Matter
Immunofluorescence assay visualization services turn microscopy evidence into a clear buyer-facing story. The science may depend on antibody specificity, sample preparation, staining conditions, exposure settings, segmentation logic and statistical confidence. The buyer usually needs a simpler answer: what does the signal prove, why is it trustworthy and how does it support the platform claim?
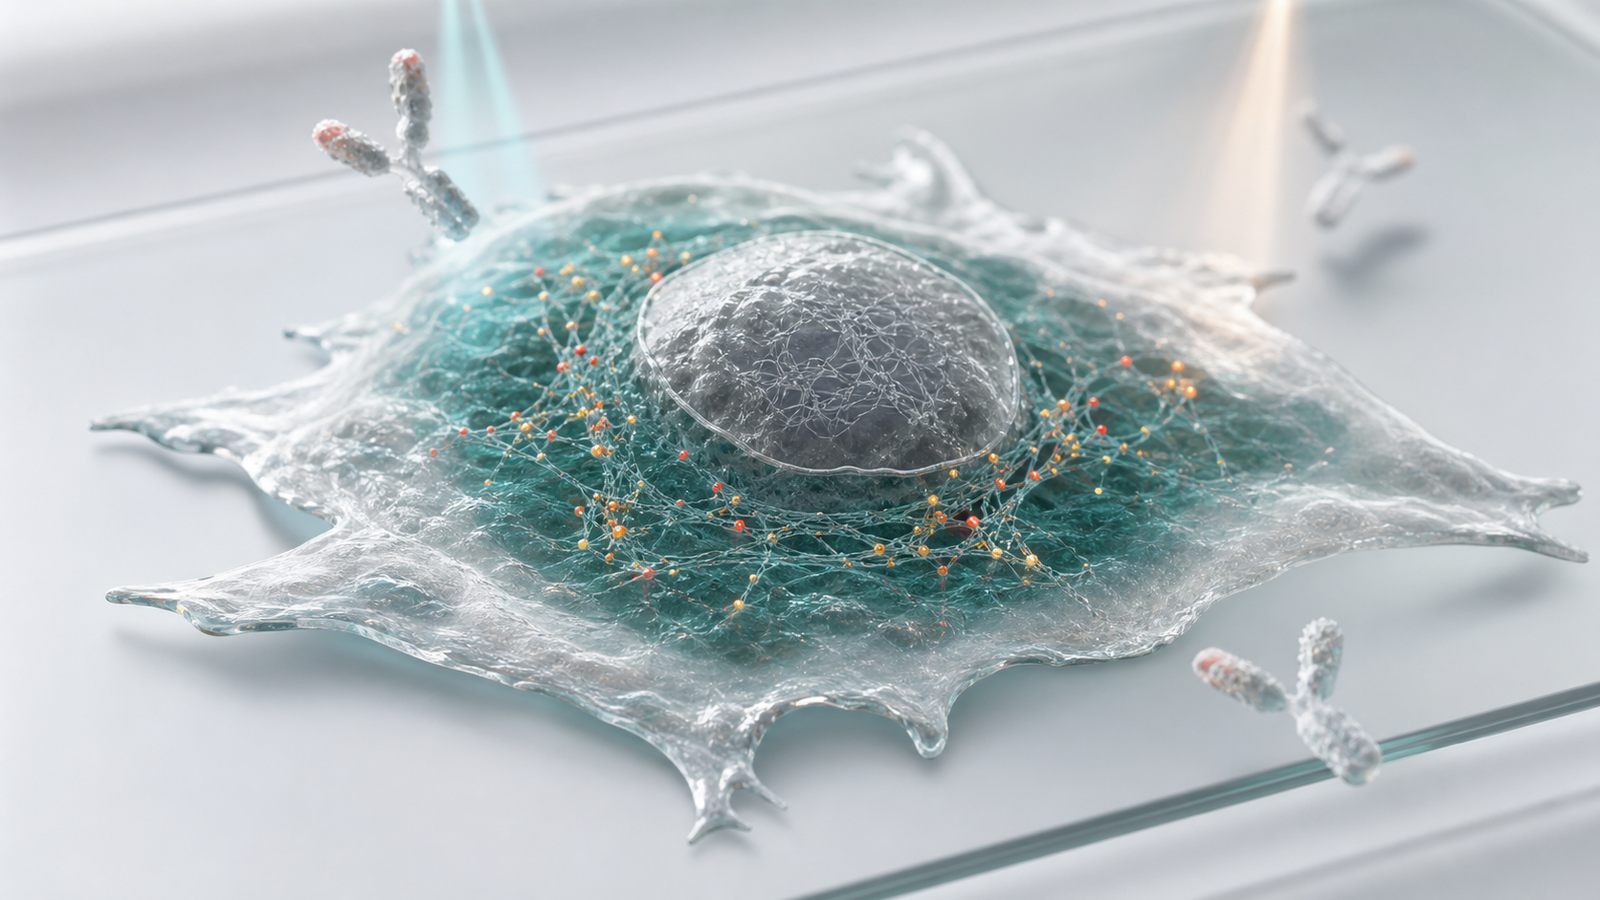
That gap matters for biotech teams using cell imaging to explain target engagement, receptor localization, pathway activation, phenotypic rescue, cytotoxicity, immune cell behavior, organoid response or biomarker expression. A raw microscopy image can be visually compelling but it often leaves commercial audiences guessing. A clear scientific render or animation can show the staining logic, the cellular context and the value of the readout before the audience sees dense data.
Animiotics builds immunofluorescence visuals for teams that need credible scientific communication across websites, investor decks, conference loops, partner presentations and sales materials. The goal is not to replace real microscopy data. The goal is to make the evidence easier to understand, easier to remember and easier to connect to a decision.
- Use visualization when cell imaging evidence is strong but hard to explain quickly.
- Show what the antibody marks, where the signal appears and why that location matters.
- Connect microscopy evidence to buyer concerns such as specificity, reproducibility, mechanism and platform confidence.
What Buyers Need To See In Immunofluorescence Evidence
Scientific teams often evaluate immunofluorescence with controls, exposure normalization, channel separation, segmentation masks, intensity distributions and replicate statistics. Buyers ask a different set of questions. Is the assay specific? Does the marker appear in the right cellular compartment? Does the treatment change the signal in a way that supports the mechanism? Can the same readout scale across programs, samples or customers?
A useful visual should make those questions visible without pretending the assay is simple. For antibody staining, the audience needs to understand target recognition and background control. For colocalization, they need to see that two signals occupy the same biological structure rather than merely overlapping in a decorative image. For quantification, they need confidence that the readout comes from cells, compartments and thresholds that were chosen for a reason.
The best immunofluorescence visuals combine cellular context with method logic. They show the membrane, nucleus, cytoskeleton, organelle or biomarker as a physical subject. Then they use restraint to highlight the evidence: one binding event, one compartment, one signal transition or one clear comparison. This makes the image commercially useful instead of simply beautiful.
- Specificity: show the marker and the control logic that makes the signal credible.
- Localization: show whether the signal belongs at the membrane, nucleus, cytoplasm or organelle.
- Colocalization: show the biological structure that links two markers.
- Quantification: show how images become evidence without fake charts or labels.
Antibody Staining Visualization For Specificity And Controls
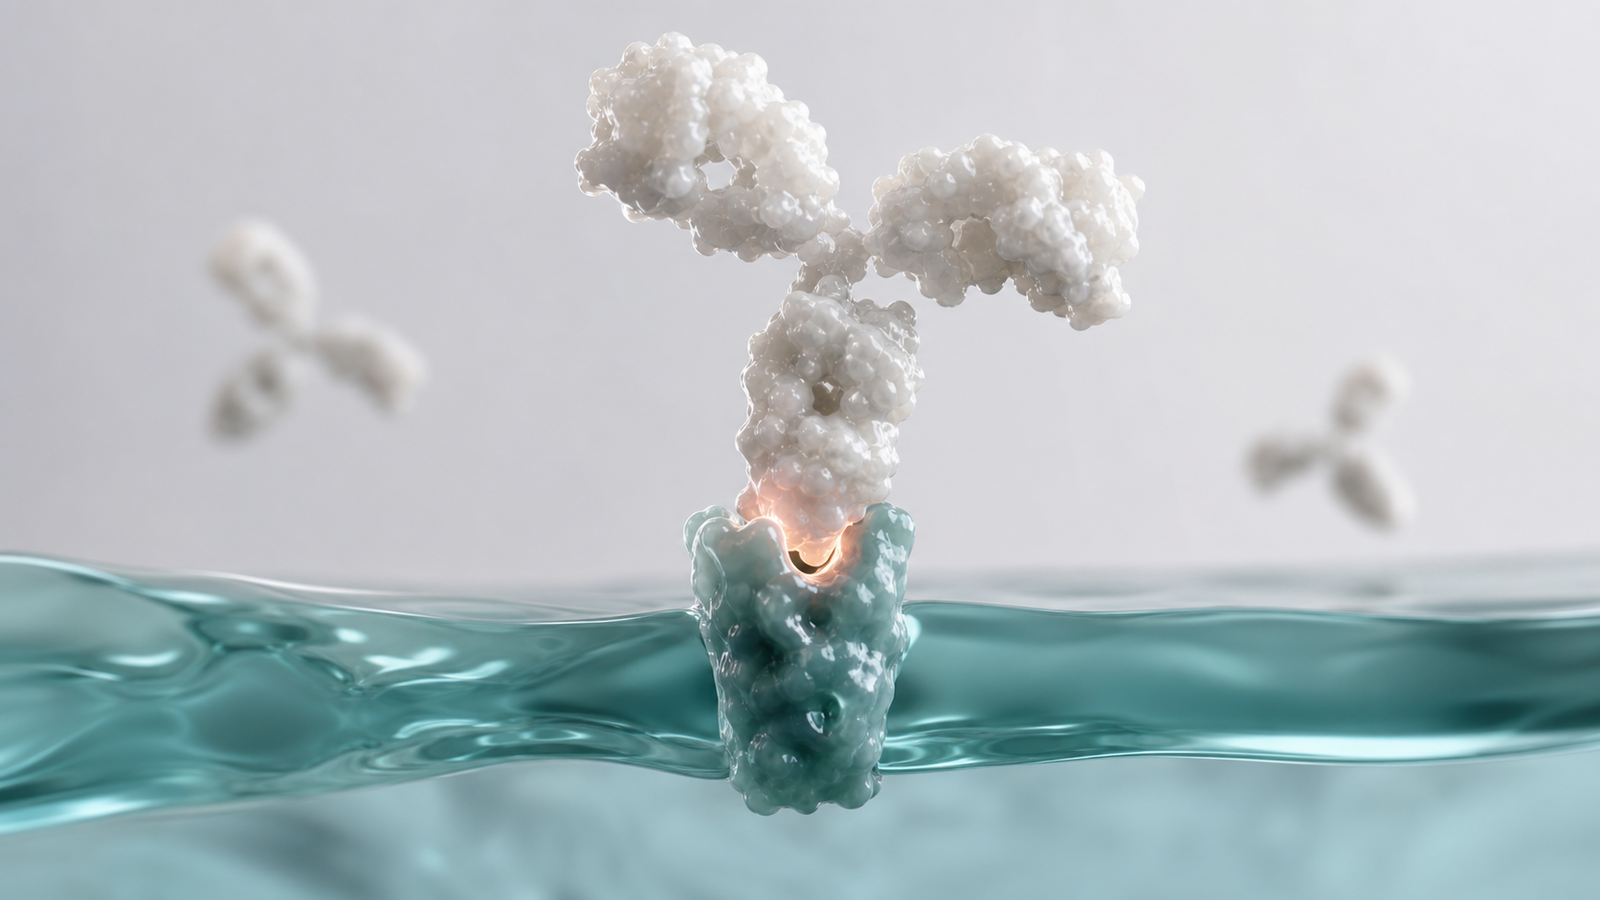
Antibody staining visualization is valuable when a platform claim depends on selective recognition. A flat image may show bright signal, but buyers still need to know what the antibody is binding and why the pattern should be trusted. A 3D render can show the antibody, antigen and cellular compartment in one readable scene while preserving the idea that specificity is earned through controls.
For therapeutic teams, staining can support receptor expression, target engagement, pathway inhibition, immune synapse formation or phenotypic change. For diagnostics teams, staining can support biomarker presence, sample quality and assay robustness. For tool companies, staining may prove that the platform can reveal a biological feature that competing approaches miss. Each of these stories benefits from a visual hierarchy that separates the target signal from background noise.
Good staining visuals avoid the common mistake of flooding the image with colored dots. The audience should not feel as if every surface is glowing. Instead, the hero should be one specific binding event, a clean membrane region or a controlled intracellular target. The supporting details can suggest controls, secondary reagents or wash steps only when they clarify the story.
- Make the antigen or receptor the hero instead of making the microscope the hero.
- Use color only where it communicates signal, specificity or control logic.
- Keep antibody fragments, cell membranes and biomarker surfaces physically plausible.
| Assay concern | Buyer question | Visual emphasis |
|---|---|---|
| Primary antibody specificity | Is the signal target driven? | Single antibody-antigen interaction with restrained signal |
| Background staining | Can noise be distinguished from biology? | Clean target zone with subtle non-target context |
| Compartment localization | Is the marker in the expected place? | Membrane, nuclear or organelle context around the signal |
| Treatment response | Does the mechanism change the marker? | Before and after signal logic without fake panels |
Colocalization Analysis Visualization For Mechanism Confidence
Colocalization analysis visualization helps teams explain why two signals appearing near each other is biologically meaningful. This is a common communication challenge in immunology, oncology, neuroscience, cell therapy, targeted degradation, receptor biology and intracellular delivery. A buyer may see merged channels and assume the story is obvious. A scientist knows that overlap needs context, controls and a clear definition of the structure being measured.
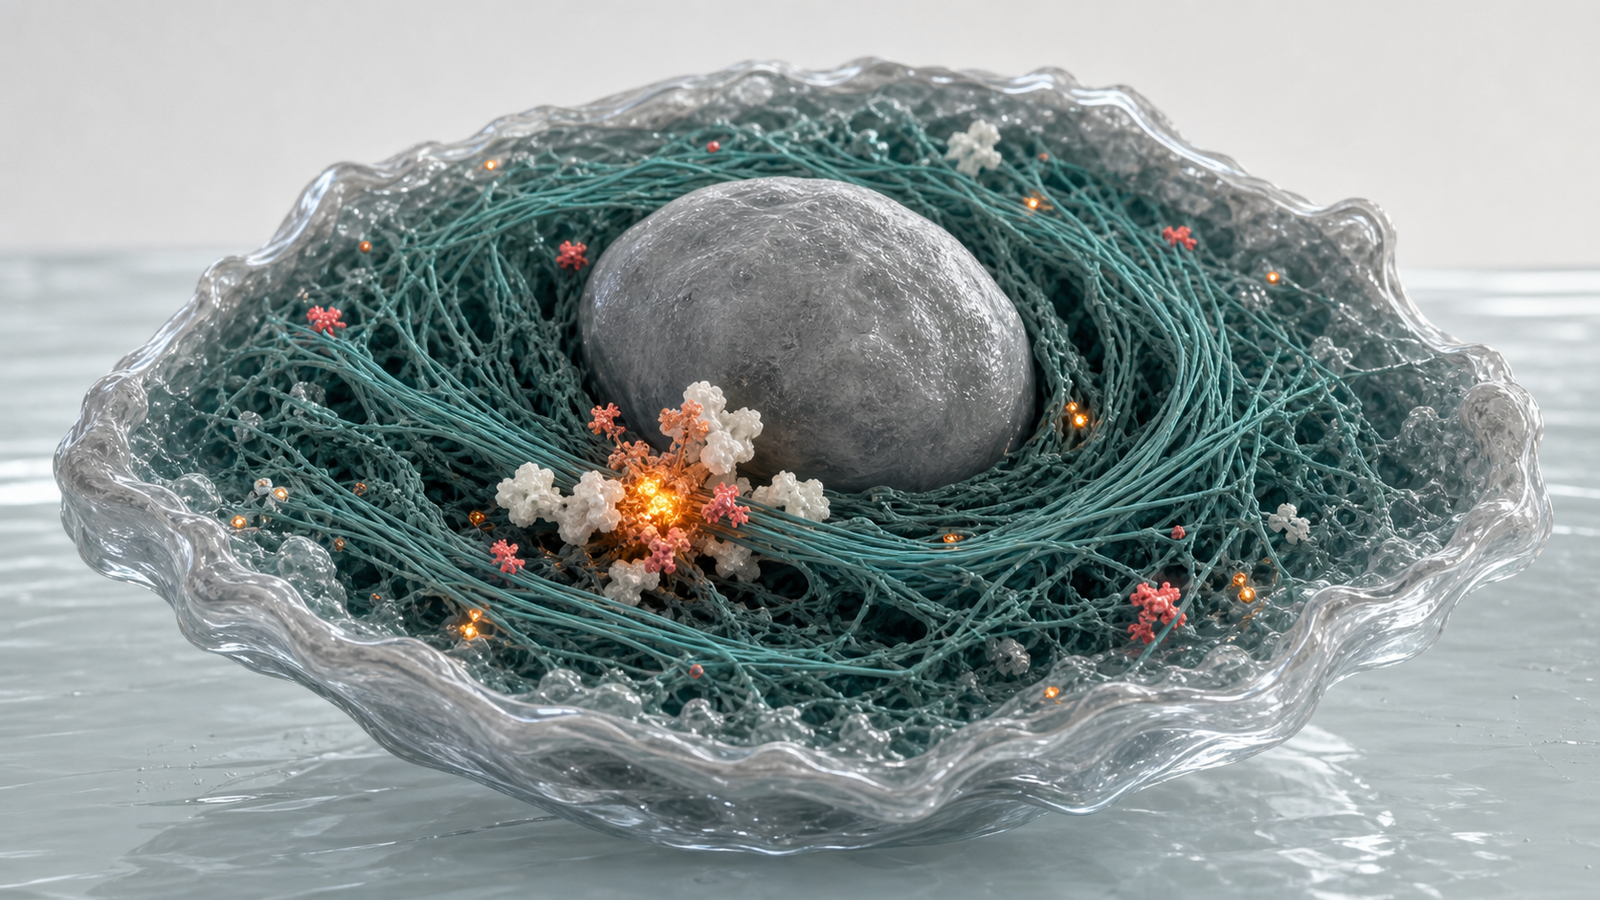
A strong colocalization render can focus on one cellular structure where two markers converge. It might show a receptor and signaling complex at the membrane, an endosomal cargo and escape marker, a nuclear transcription marker or a cytoskeletal structure that recruits a drug-induced complex. The visual should make the shared biological context clear before any numerical coefficient appears in a technical slide.
For commercial use, colocalization scenes should be selective. One bright amber or coral region can be more persuasive than a field of random fluorescent spots. The image should help the audience understand mechanism confidence: the right molecules are in the right place at the right stage of the assay.
- Show the compartment or structure that makes overlap meaningful.
- Avoid implying certainty when the real data needs controls and thresholds.
- Use animation when the value depends on movement, recruitment or temporal change.
Image Quantification Visualization For Reproducible Assay Claims
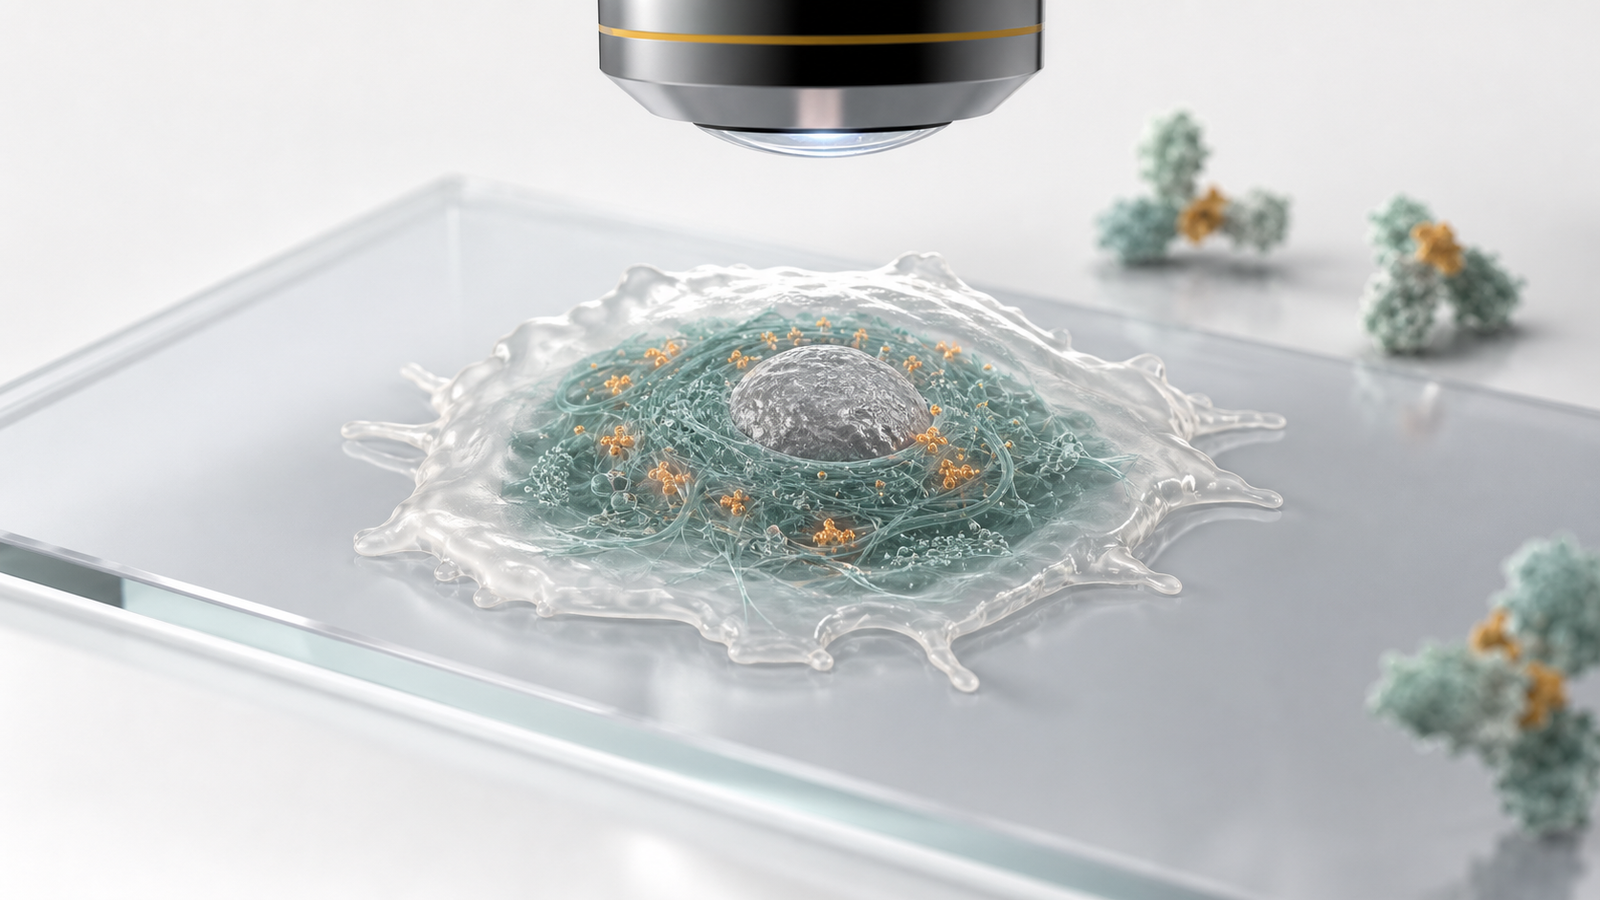
Image quantification visualization is where many biotech stories become either credible or confusing. Segmentation, thresholding, intensity measurement, object counting and region selection are powerful, but they can feel opaque to non-specialist buyers. A useful visual should show how a cell image becomes a quantified claim without turning the asset into a fake software screenshot.
The visual structure can show a single microscopy sample with a clear cellular boundary, a nuclear region and a target signal that belongs to a specific compartment. The next frame in an animation might reveal the measured region, the signal population and the quality-control concept. For still imagery, the same idea can be communicated through composition and hierarchy: the viewer understands which biological feature is being measured before reading the copy.
This matters for platform companies because reproducibility is a buyer concern. A beautiful microscopy image can attract attention, but a quantified assay story earns confidence. When the visual connects image quality, biological context and measurement logic, it helps buyers see why the platform can support decisions across samples or programs.
- Explain what is measured before showing how much changed.
- Represent segmentation and measurement as scientific logic rather than UI decoration.
- Use visuals to connect assay repeatability with platform value.
Where Immunofluorescence Animation Creates Commercial Value
Immunofluorescence animation is especially useful when the assay supports a larger mechanism or platform story. A short sequence can show sample preparation, antibody binding, fluorescent signal formation, cellular localization and quantitative readout. That journey helps buyers understand why the assay is not just a pretty image but a proof layer in the company story.
For drug discovery teams, the animation may explain target engagement or pathway modulation. For cell therapy teams, it may show immune cell activation, synapse formation or phenotype confirmation. For organoid and spatial biology teams, it can connect marker expression to tissue-like context. For diagnostic and tool companies, it can show why the platform sees a marker clearly enough to support a customer decision.
This topic also connects naturally to other assay visuals. Teams comparing imaging with flow or plate readouts may benefit from related resources such as https://animiotics.com/blog/flow-cytometry-visualization-services-how-to-explain-gating-panels-cell-phenotypes-and-platform-value-clearly/ and https://animiotics.com/blog/elisa-assay-animation-services-how-to-explain-biomarker-binding-signal-development-and-platform-value-clearly/. The key is to show the specific role of each assay rather than treating all signals as the same.
- Use animation when localization, recruitment or time matters.
- Use premium still renders when the buyer needs one memorable proof image.
- Use slide figures when controls, comparisons and quantitative evidence need more detail.
How Animiotics Builds Buyer Ready Immunofluorescence Visuals
Animiotics starts by defining the buyer decision behind the image. The visual for a fundraising deck may need to prove that a mechanism is tractable. A website hero image may need to communicate platform sophistication. A conference loop may need to show staining, signal emergence and quantification in a few seconds. A technical sales deck may need enough detail to satisfy scientific reviewers without slowing the conversation.
Next, we map the biology into a focused scene. The central subject might be a membrane receptor, a nuclear marker, a cytoskeletal structure, an organelle, a cell-cell interaction or a biomarker-positive cell. Supporting elements are kept limited: antibody fragments, light paths, sample glass or a few signal points. This keeps the visual credible and prevents the busy collage effect that weakens many assay graphics.
The final art direction uses premium 3D scientific rendering, clean silhouettes, restrained color, subtle depth of field and physically plausible materials. The image should feel like a serious biotech asset rather than a decorative illustration. That is especially important for immunofluorescence, where trust depends on signal discipline.
- Start with the claim the assay supports.
- Choose one hero subject and only the supporting forms needed for clarity.
- Keep color disciplined so the signal feels meaningful.
- Build separate versions for web, pitch decks, launch campaigns and technical sales use.
FAQ: Immunofluorescence Assay Visualization Services
What are immunofluorescence assay visualization services?
AThey are scientific render, figure and animation services that help biotech teams explain antibody staining, cellular localization, colocalization evidence, fluorescence signal formation and image quantification. The deliverables can support websites, investor decks, conference assets, technical explainers and partner conversations.
Can visuals explain immunofluorescence without showing confidential images?
AYes. A render can communicate the assay logic, target biology and measurement concept while keeping raw images, proprietary markers and unpublished data private. Technical materials can still include real images where appropriate.
Are these services useful for platform companies?
AYes. They are useful for imaging platforms, drug discovery companies, diagnostics teams, cell therapy groups, organoid model companies and translational research teams that need to explain why a fluorescence readout supports value.
How should teams avoid overclaiming with fluorescence visuals?
AThe visual should show the biological idea and evidence structure without inventing quantitative results. If the claim depends on controls, segmentation or replicate statistics, those details should be handled in the supporting figure or technical copy.
Ready To Turn Immunofluorescence Evidence Into Buyer Ready Visuals
Immunofluorescence assay visualization services help biotech teams turn staining patterns, colocalization evidence and image quantification into a story that scientific buyers can understand quickly. The right visual makes the signal feel specific, the mechanism feel grounded and the platform value feel easier to evaluate.
Animiotics creates premium 3D scientific renders, mechanism visuals and animation assets for biotech teams that need microscopy evidence to work harder in sales, fundraising, launches and partnerships. If your assay images are compelling but the story takes too long to explain, build a focused visual system around the decision your audience needs to make. See more at Animiotics.
- Use a cover render for the central cellular proof concept.
- Use in-post or deck visuals for staining specificity, colocalization and quantification logic.
- Keep the visual language restrained, scientific and focused on buyer confidence.