Why Cell Signaling Animation Services Matter
Cell signaling animation services matter because pathway biology is often where a biotech platform becomes commercially believable. A buyer may understand that a receptor is activated or a kinase is inhibited, but still miss why that event changes disease biology, biomarker response or platform value. Static pathway diagrams can name the players while leaving the logic hard to see.
Clear signaling visuals turn receptors, ligands, adapters, kinases, second messengers, transcription factors and feedback loops into a story that can be reviewed by scientists and remembered by business audiences. The goal is not to decorate a pathway map. The goal is to show what starts the signal, how it moves, where it branches, what evidence supports it and why the company has a differentiated way to intervene.
Animiotics builds cell signaling animation services for biotech, pharma, platform and research teams that need website renders, investor deck figures, mechanism animations, conference loops and scientific review assets. The work is most useful when it connects molecular mechanism to therapeutic value without overstating the evidence.
- Use signaling visuals when receptor activation, pathway modulation and downstream response need fast explanation.
- Keep extracellular trigger, membrane event, intracellular relay and functional output visually distinct.
- Design scenes that can support scientific review, fundraising, partnering and website education.
Start With the Receptor Event
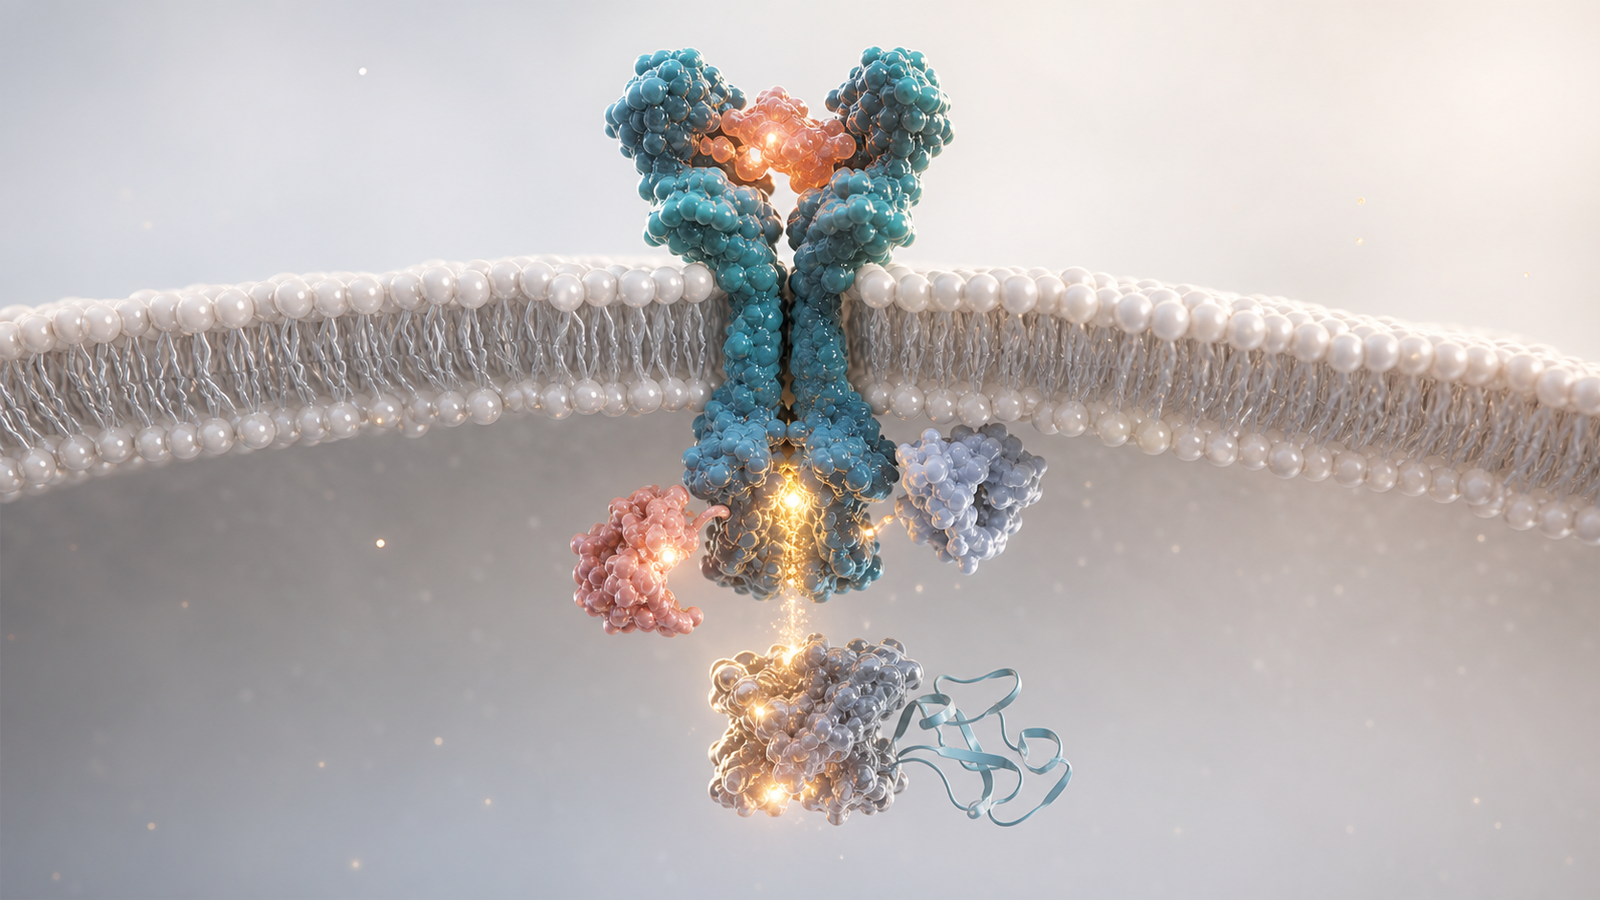
A strong signaling animation usually begins at the membrane. Viewers need to see the initiating event before they can understand downstream pathway logic. That event might be ligand binding, receptor dimerization, immune synapse formation, ion channel opening, kinase activation or receptor internalization. A clear membrane scene gives the audience a stable anchor for the rest of the story.
This first scene should avoid trying to show the entire pathway at once. A polished receptor render can show one ligand, one membrane domain and one immediate intracellular response. The visual hierarchy tells the viewer where to look, while narration or slide copy can handle the detailed terminology. This approach is especially useful for website hero images and short investor deck sequences.
For receptor-heavy programs, signaling visuals can complement deeper mechanism assets such as GPCR signaling animation without repeating that article. The broader signaling story can cover receptor tyrosine kinases, cytokine receptors, checkpoint receptors, pattern recognition receptors or engineered receptors.
- Show the receptor as a designed biological switch before showing the whole cascade.
- Use one clear ligand or interaction cue rather than a crowded molecular scene.
- Keep the membrane plane readable so the outside and inside of the cell stay obvious.
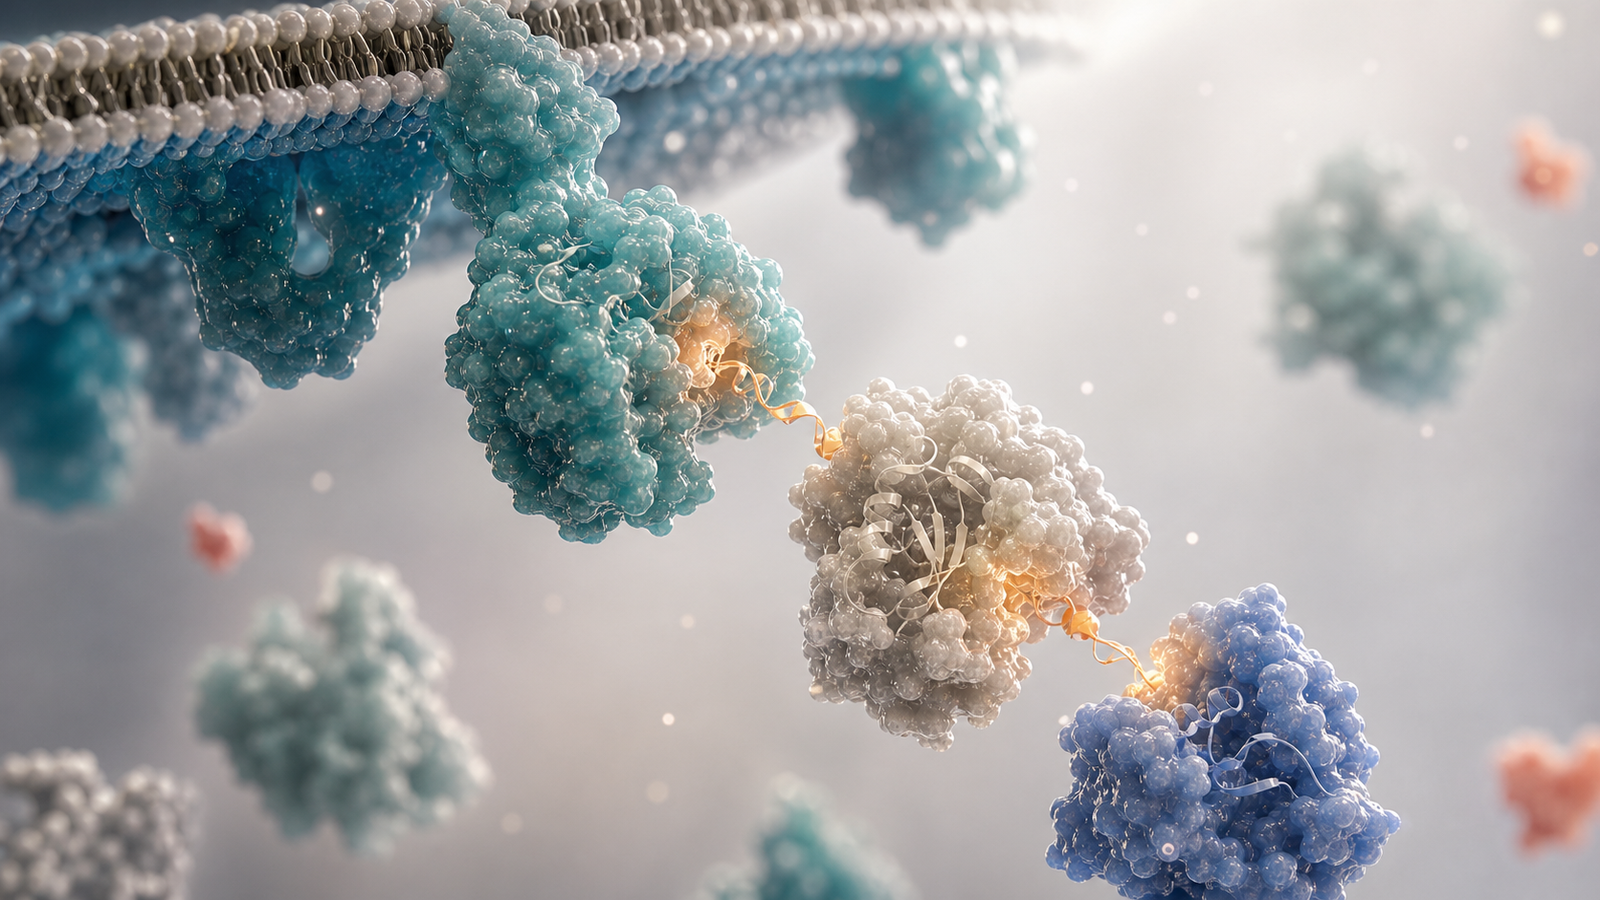
Translate Pathway Logic Into Visual Beats
Pathway diagrams often compress cause and effect into a dense field of arrows. Animation works better when the pathway becomes a sequence of visual beats. The receptor activates, an adapter is recruited, a kinase relay begins, a branch point appears, a transcription factor moves toward the nucleus and a cellular response becomes visible. Each beat should answer one buyer question.
The sequence does not need to be molecularly exhaustive. In fact, including every intermediate can make the platform feel less clear. A useful signaling animation chooses the steps that explain the therapeutic claim. If a drug blocks a specific branch, the scene should emphasize that branch. If a platform tunes response amplitude, the visual should show signal strength and feedback rather than a generic cascade.
This is where cell signaling animation services can be more commercially useful than a single pathway graphic. A storyboard can show how one molecule changes the signal at multiple scales: receptor engagement, intracellular propagation, biomarker readout and disease-context response. That layered view helps investors and partners understand why the biology matters.
- Break receptor activation, relay, branch point and output into separate reviewable scenes.
- Show only the intermediates that support the commercial or scientific claim.
- Use motion, focus and material changes to show direction without filling the image with arrows.
| Buyer Question | Visual Priority | Best Asset |
|---|---|---|
| What starts the pathway? | Ligand or cellular trigger interacting with one receptor complex | Website hero render |
| Where does the drug act? | Target protein highlighted within a restrained pathway relay | Investor deck mechanism slide |
| How is response measured? | Biomarker output separated from conceptual mechanism | Scientific review figure |
| Why is the platform repeatable? | Comparable receptor or pathway modules using one material language | Partnering package |
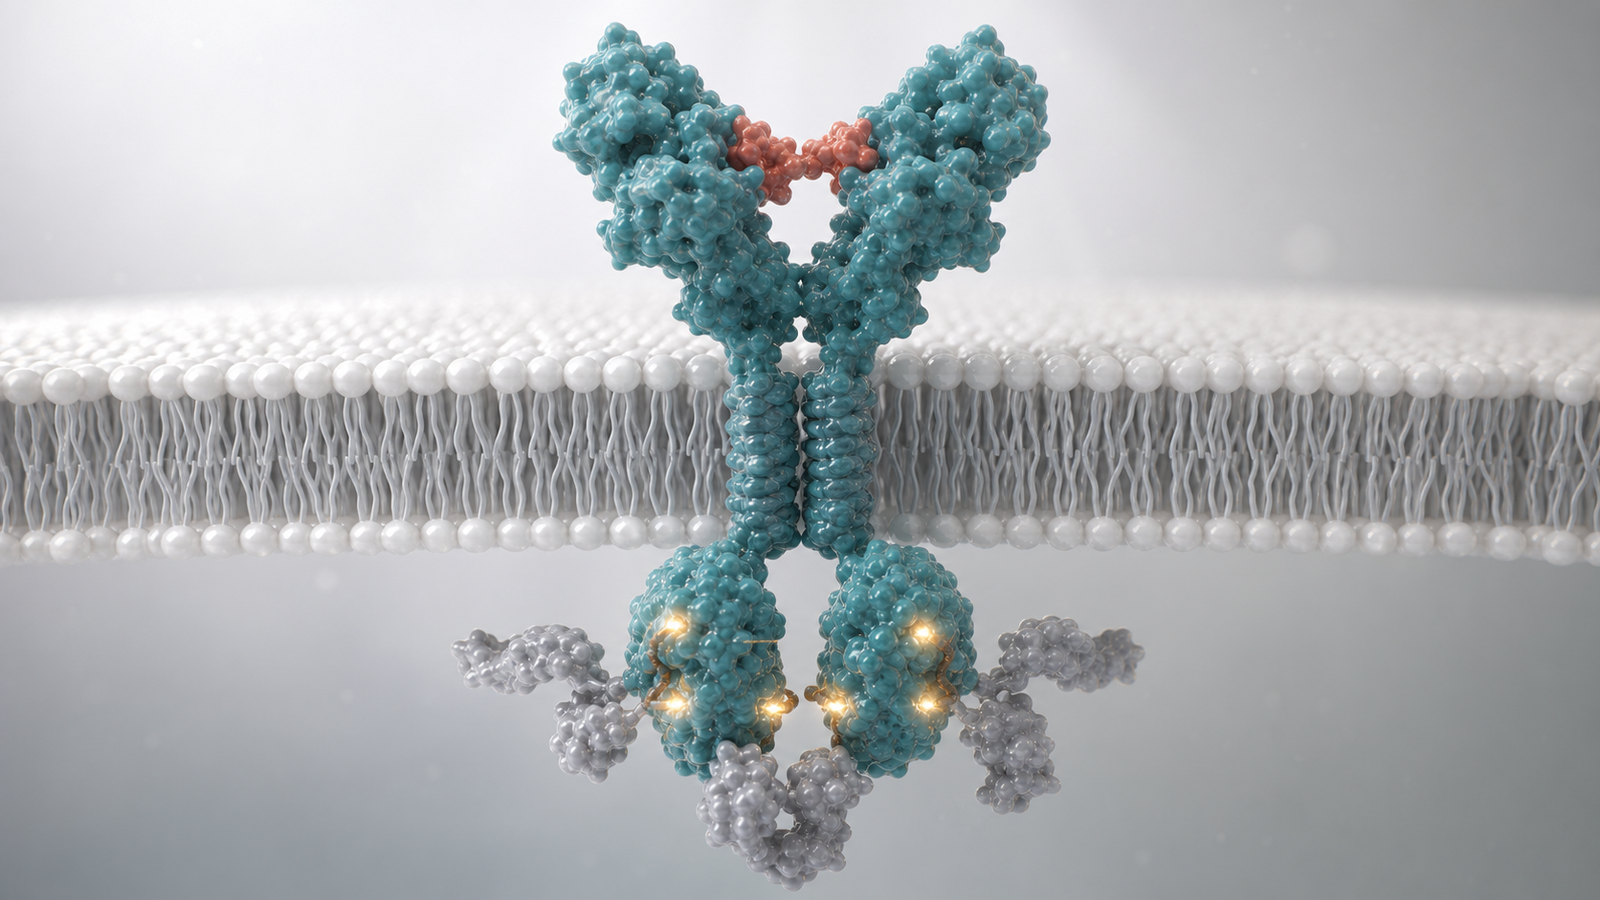
Make Feedback and Crosstalk Understandable
Feedback is where many signaling stories become hard to follow. A pathway rarely moves in a simple straight line. Negative feedback can dampen a signal, positive feedback can amplify response and crosstalk can connect one pathway to another. These mechanisms are important, but they can overwhelm a viewer if they appear as a tangle of arrows.
A better approach is to give feedback its own visual beat. The main signal appears first. Then a second scene shows the feedback regulator returning to the pathway with a different material, glow level or motion pattern. Crosstalk can be shown as one neighboring module that touches the primary relay only at the relevant node. The viewer sees regulation without losing the main thread.
This matters for biotech platforms that sell precision, selectivity or tunable response. If the platform claim depends on avoiding pathway overactivation, escaping resistance, changing immune tone or balancing efficacy and safety, feedback should be visible. The animation should make regulation look engineered rather than accidental.
- Show the main pathway before introducing feedback or crosstalk.
- Use one regulatory module at a time so the mechanism stays legible.
- Reserve quantitative claims for companion data figures, captions or assay visuals.
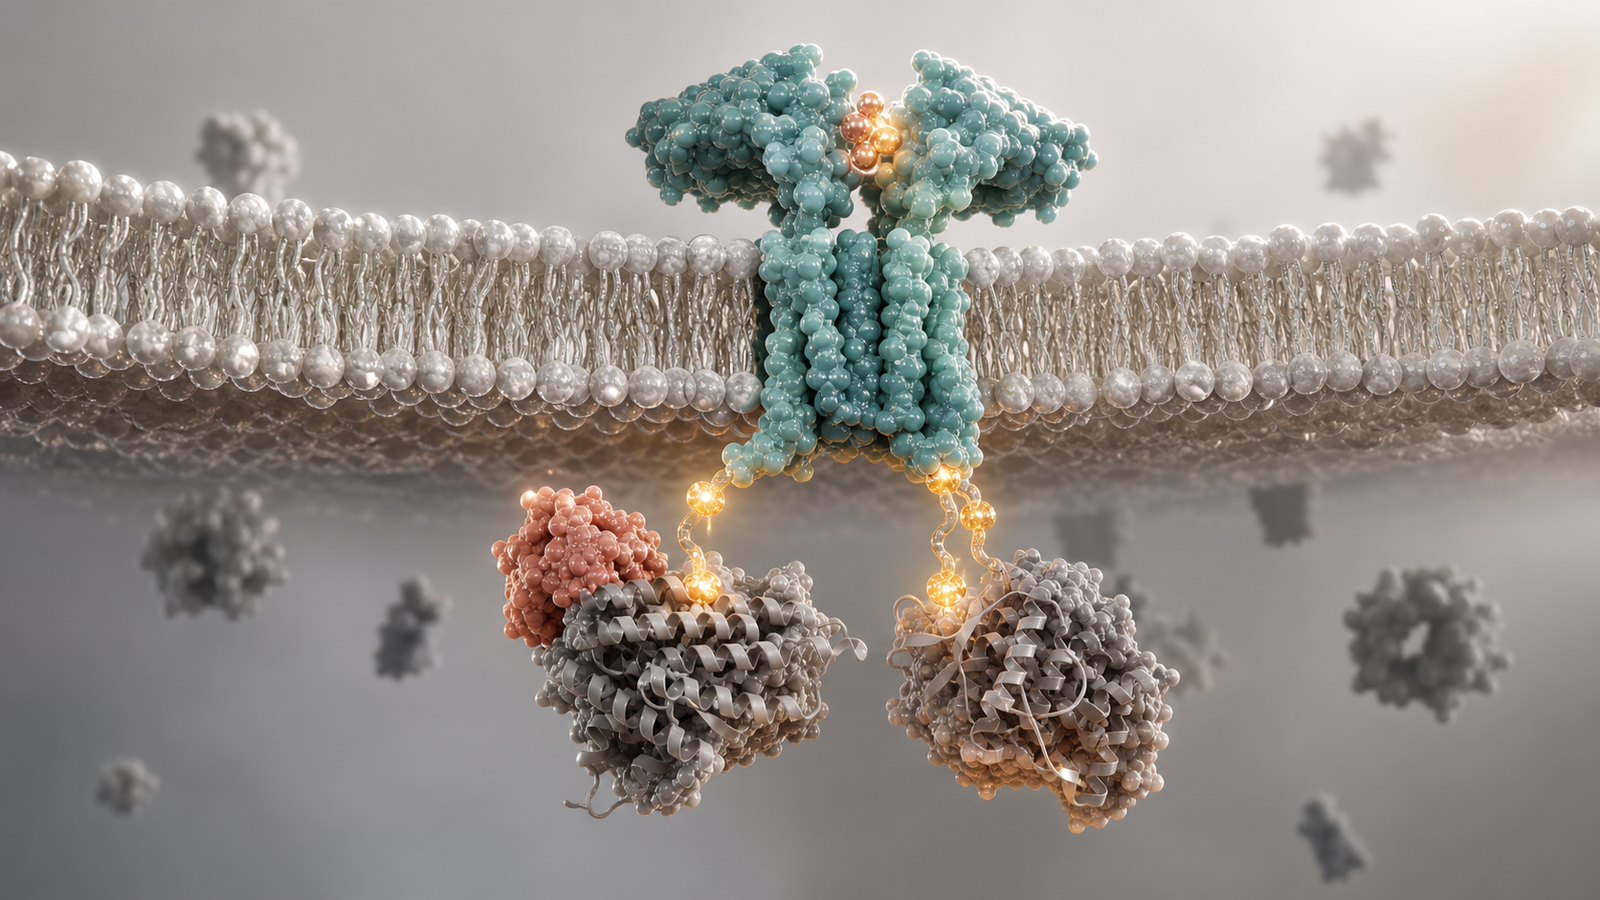
Connect Signaling to Biomarkers and Evidence
Cell signaling visuals become stronger when they connect mechanism to evidence. Buyers want to know how the pathway is measured. That evidence might include phosphorylation markers, transcriptional signatures, cytokine release, reporter assays, imaging readouts, single-cell data or pharmacodynamic biomarkers. The animation should show where those readouts fit without turning the scene into a chart.
A clean way to do this is to separate conceptual mechanism from measured evidence. The render shows the receptor and signaling relay. A companion figure or later storyboard scene shows the biomarker output. This keeps the scientific claim reviewable and avoids implying that a conceptual glow is a quantitative result.
The same discipline supports related work such as translational biomarker visualization services when a team needs to connect pathway modulation to patient selection, pharmacodynamics or clinical response. Signaling animation explains the biological logic, while biomarker visuals explain how the team knows the logic is working.
- Use separate scenes for mechanism and measured pathway response.
- Map biomarkers to pathway nodes instead of scattering assay icons everywhere.
- Let captions carry assay names, sample type and evidence status.
Build a Reusable Signaling Visual System
Many biotech teams need more than one signaling asset. The same platform may target multiple receptors, adapt one pathway to several indications or compare pathway behavior across cell types. Cell signaling animation services are most valuable when the assets come from one reusable visual system rather than a series of unrelated one-off graphics.
A reusable system defines how receptors look, how membranes are framed, how active proteins differ from inactive proteins, how feedback is shown and how biomarker evidence is separated from mechanism. Once those rules are in place, the team can create website visuals, deck figures, scientific review slides, booth loops and animation scenes that feel like one mature communication system.
Consistency is commercially important. If every pathway render has a different style, buyers may read the platform as fragmented. If receptor events, relay modules, response scenes and evidence layers share one material language, the company looks more disciplined. That is especially useful for platform companies presenting multiple programs to investors or pharma partners.
- Define a stable visual language for receptors, relays, regulators and outputs.
- Plan crops for website, deck, conference screen and animation formats at the start.
- Reuse clean 3D assets so new indications can be added without rebuilding the story.
| Asset | Purpose | Visual Rule |
|---|---|---|
| Cover render | Introduce the pathway as a premium platform visual | One receptor hero subject with a few supporting proteins |
| Mechanism scene | Show activation and relay logic | Clear outside-inside membrane orientation |
| Evidence scene | Connect pathway changes to biomarkers | Separate measured readout from conceptual signal |
| Platform module | Compare programs or cell contexts | Same materials, camera logic and color hierarchy |
Storyboard Cell Signaling for Buyers
A practical signaling storyboard follows how a buyer evaluates the science. First, show the cell context and receptor. Second, show the initiating interaction. Third, move inside the cell and show the first signaling relay. Fourth, show the key branch or intervention point. Fifth, connect the pathway to biomarker evidence. Sixth, show how the same visual system supports additional programs.
This order gives internal teams a clean review process. Discovery scientists can verify the target event. Translational teams can check biomarker logic. Commercial teams can confirm that the platform value is visible. Leadership can decide whether the asset is strong enough for a website, investor deck, partnering package or conference campaign.
The storyboard should keep labels outside the render whenever possible. Labels are useful in slides, captions and narration, but visible text inside the image often makes the visual feel like an infographic rather than a premium scientific render. The strongest assets can work as silent visuals and still make the pathway feel understandable.
- Storyboard the buyer journey before rendering individual scenes.
- Assign one scientific claim to each image or animation beat.
- Keep technical terms in captions, voiceover or slide copy instead of inside the render.
FAQ About Cell Signaling Animation Services
What are cell signaling animation services?
AThey are scientific visualization services that turn receptor activation, intracellular pathway relays, feedback, crosstalk, biomarkers and cellular response into clear 3D renders, figures and animation-ready storyboards.
Who uses cell signaling visuals?
ABiotech companies, pharma teams, platform biology groups, translational scientists, academic spinouts and research organizations use them for websites, pitch decks, partnering materials, conference content and scientific education.
How are cell signaling animation services different from a pathway diagram?
AA pathway diagram names relationships. A signaling animation shows sequence, spatial context, molecular interaction, intervention point and response hierarchy so buyers can understand the mechanism faster.
Can signaling visuals include real data?
AYes. The clearest projects combine conceptual mechanism scenes with evidence such as phosphorylation data, reporter assays, cytokine response, transcriptomic signatures, imaging data or pharmacodynamic biomarkers. The measured evidence should stay visually distinct from the conceptual mechanism.
- Use signaling animation when pathway logic and platform value need to be understood quickly.
- Keep mechanism, regulation and evidence as separate but connected visual layers.
- Build reusable assets when the platform covers multiple receptors, pathways or indications.
Ready to Build Cell Signaling Visuals
Cell signaling animation services are most useful when they help buyers see why a pathway intervention matters. The right assets explain receptor activation, intracellular relay logic, branch points, feedback, biomarkers and platform repeatability in a way that supports commercial conversations while respecting scientific review.
Animiotics helps biotech, pharma, platform and research teams create signaling pathway renders, receptor activation visuals, kinase pathway animation storyboards, investor deck figures, website assets and animation-ready scenes. The work can support fundraising, partnering, conference launches, board updates, scientific education and translational planning.
Talk to Animiotics about cell signaling animation services
- Bring target pathway, receptor context, intervention point, evidence package and buyer audience into the first brief.
- Use one visual system for receptor events, intracellular relays, biomarkers and platform modules.
- Turn complex pathway biology into buyer-ready visuals without turning the science into a cluttered diagram.