Why Analytical Characterization Visualization Services Matter
Analytical characterization visualization services turn dense CMC evidence into a clear scientific story for biotech executives, platform buyers, investors, partners and regulatory-facing teams. The raw data may live in chromatograms, mass spectra, peptide maps, thermal curves, capillary electrophoresis traces, glycan profiles and stability tables. The business problem is different: decision makers need to see what the data proves, where the risk sits and why the program is controlled enough to fund, license or advance.
This is especially important for biologics, protein therapeutics, antibody platforms, enzyme programs, viral vectors, RNA delivery systems and complex formulation work. A single claim such as purity improved, impurity risk is controlled or the post-change product remains comparable can require several analytical methods. A strong visual system lets the audience follow the logic without asking them to read every peak label. It preserves scientific accuracy while making the conclusion easier to inspect.
Animiotics builds analytical characterization visuals for teams that need more than a decorative science image. We design 3D renders, mechanism scenes, evidence diagrams, slide figures and short animations that connect method, molecule, measurement and platform value. The goal is not to oversimplify the data. The goal is to give scientific buyers a faster path to confidence.
- Use visualization when CMC evidence is correct but hard to explain in a pitch, partnership deck or launch page.
- Focus the story on what the assay proves rather than only showing the instrument or a generic laboratory scene.
- Tie analytical results to buyer concerns such as purity, identity, potency, stability, comparability and manufacturing control.
What Buyers Need To Understand From Characterization Data
Analytical development teams think in methods, acceptance criteria, controls and replicate evidence. Buyers often think in risk. They want to know whether the molecule is what the company says it is, whether the product remains stable, whether impurities are visible, whether a process change is controlled and whether the platform can scale without creating hidden liabilities. Characterization visuals should bridge those two views.
For HPLC and UPLC data, the visual story often starts with separation. A clean animation can show a protein, peptide, oligonucleotide or formulation component moving through a column, then connect that physical process to the output trace. For mass spectrometry, the story may be molecular identity, intact mass, peptide mapping, glycoform distribution or impurity detection. For stability work, the key visual challenge is time: clients need to see degradation pathways, stress conditions and trends without drowning in tables.
A useful characterization figure usually answers one commercial question. Can the platform detect the impurity that matters? Can the team show batch consistency? Can the molecule survive formulation stress? Can a manufacturing change be compared without losing confidence? If the image does not answer a question like that, it will not help the buyer move forward.
- Identity: show why the molecule or complex has been confirmed by orthogonal evidence.
- Purity: show the main product, related species, aggregates or fragments in a readable way.
- Stability: show what changes over time and what remains inside the target profile.
- Comparability: show pre-change and post-change evidence without turning the figure into a spreadsheet.
HPLC Visualization Services For Purity And Impurity Stories
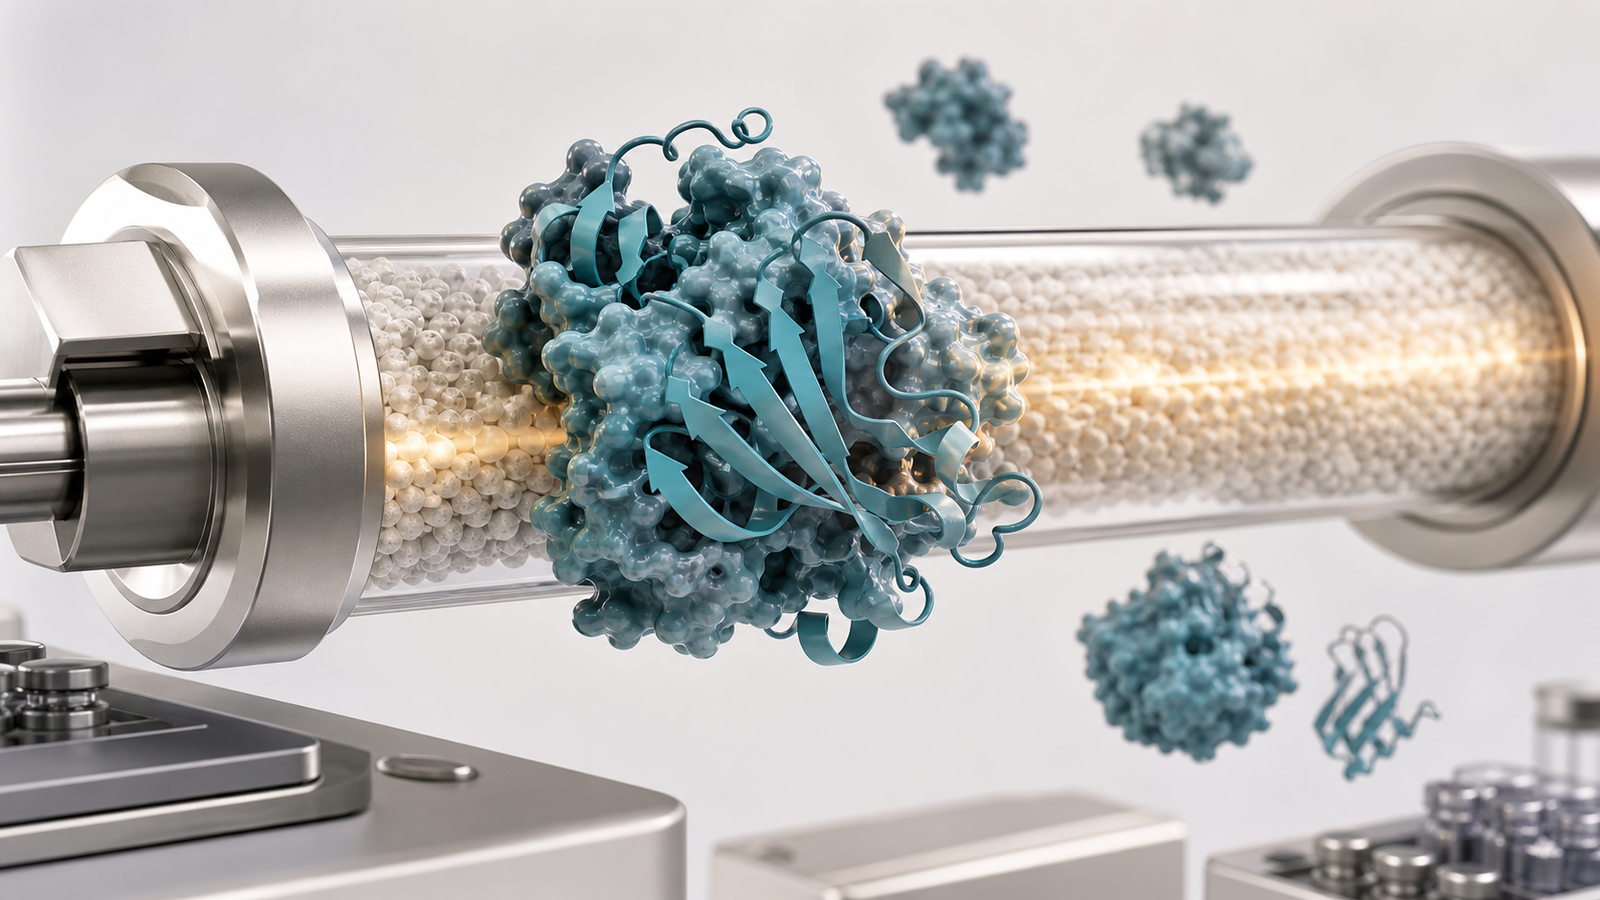
HPLC visualization services are valuable when the commercial claim depends on separation, purity, impurity control or process understanding. A chromatogram alone can be technically sufficient for a methods team. It is rarely enough for a homepage, investor meeting, conference booth or partnership deck. Buyers need to see what was separated, why the peak matters and how the method supports the platform claim.
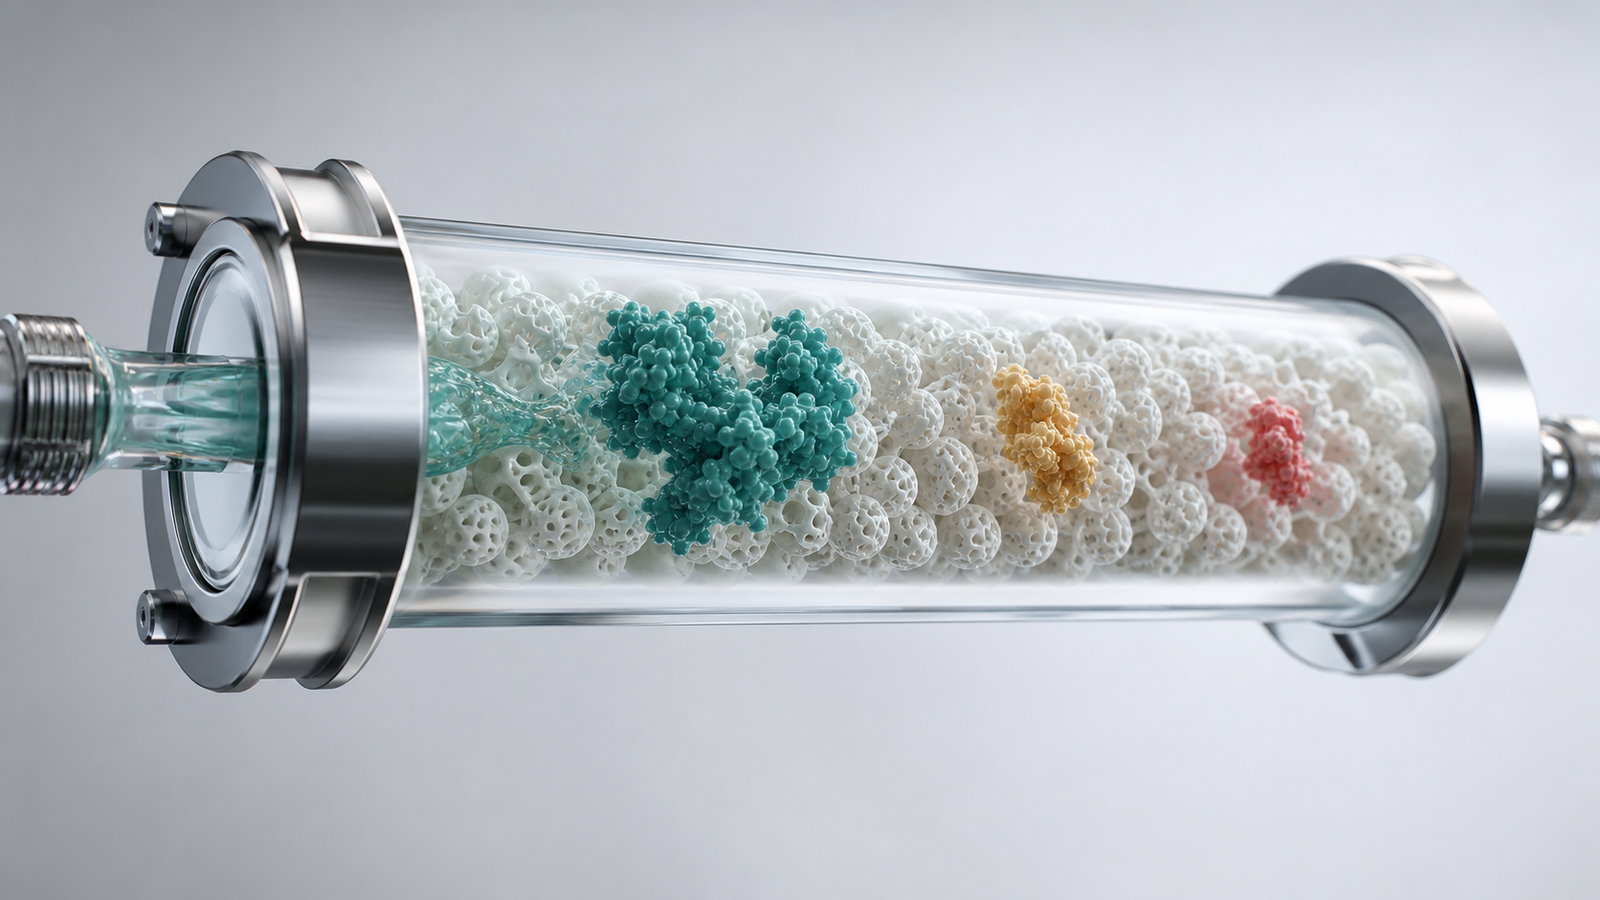
A strong HPLC visual does not need fake charts or labels. It can use a premium 3D scene to show analyte classes moving through a column matrix, with the main product in one clean path and related species subtly separated in the background. The final frame can map that process to a simplified trace or evidence concept if the deliverable is a slide figure. For blog and campaign imagery, a clean render can focus on the column, molecular stream and separated species without visible text.
The same approach works for size exclusion chromatography, ion exchange, reversed phase methods, hydrophobic interaction chromatography and oligonucleotide analysis. The art direction should not make these look like generic fluid tubes. The important scientific idea is selectivity. The image should make separation feel intentional, controlled and measurable.
- Show the product species as the hero subject, not the instrument.
- Use supporting forms for aggregates, fragments or impurities only when they clarify the story.
- Keep the scene wide, calm and readable so it can work as a web cover, slide opener or campaign asset.
| Analytical method | Buyer question | Best visual emphasis |
|---|---|---|
| Size exclusion chromatography | Is aggregation controlled? | Separated protein states with a clear main species |
| Ion exchange chromatography | Are charge variants understood? | Protein surfaces moving through a selective matrix |
| Reversed phase HPLC | Are related species resolved? | Distinct molecular bands with controlled separation |
| Oligonucleotide LC methods | Are truncations or impurities visible? | RNA strand variants with subtle length differences |
Mass Spec Animation For Identity Modification And Impurity Evidence
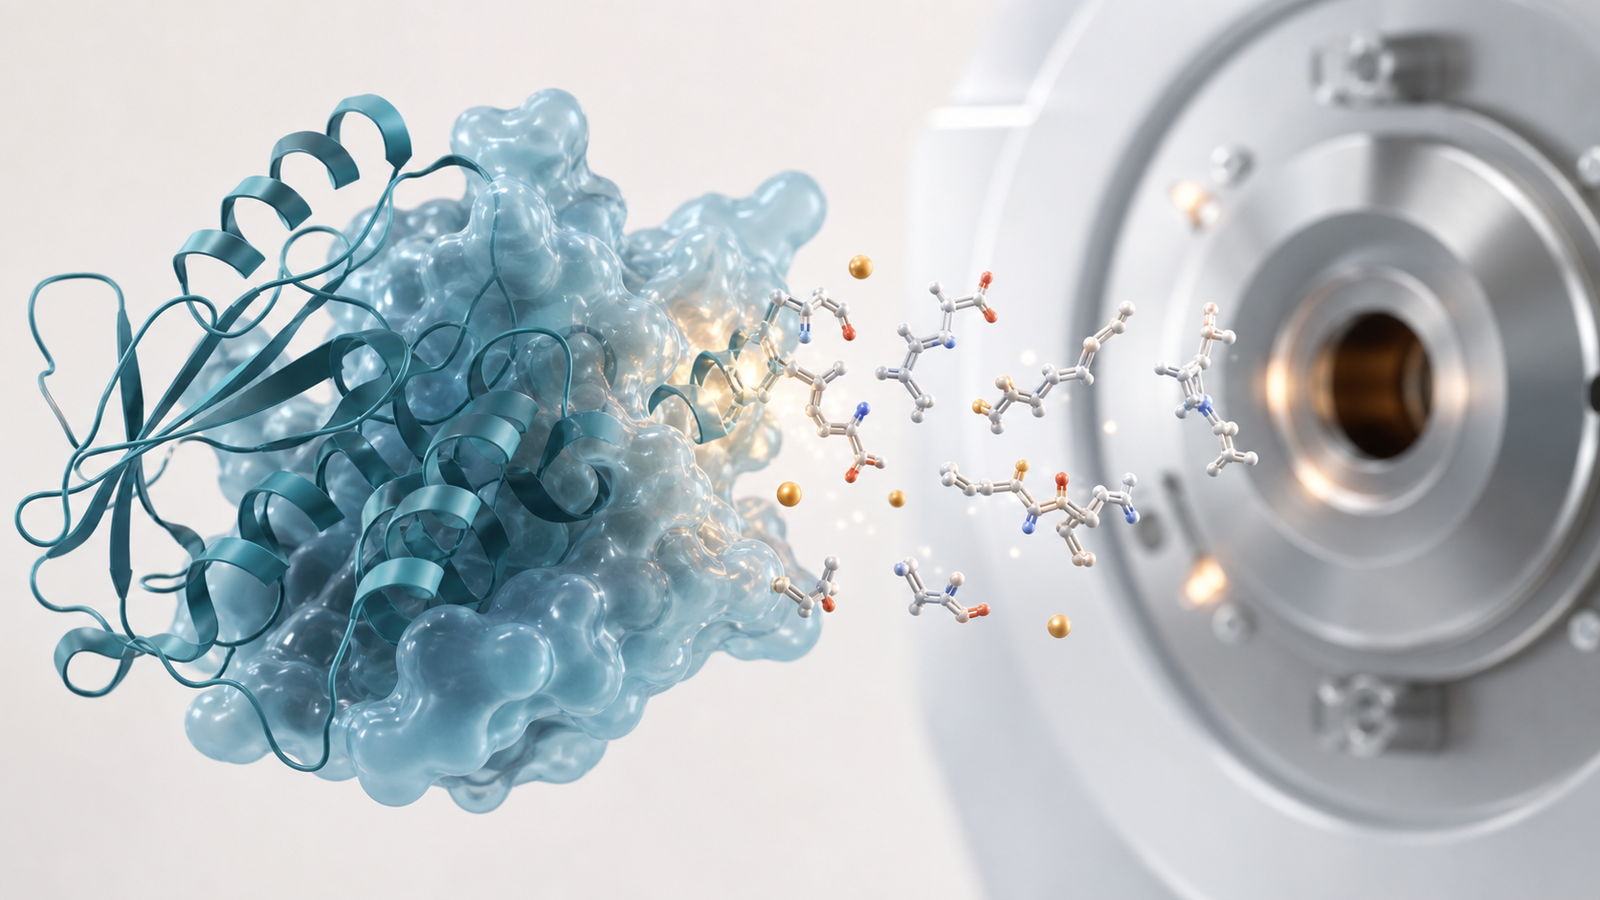
Mass spec animation helps teams explain molecular identity, post-translational modification, intact mass, peptide mapping and impurity evidence without asking the audience to interpret dense spectra. The challenge is not that mass spectrometry lacks visual interest. The challenge is that the real output can look abstract to anyone outside analytical development. Good scientific animation gives the audience a physical intuition for what is being measured.
For biologics, a render can show a folded protein, antibody region or peptide fragment transitioning into a simplified ion stream. The visual does not need to depict every instrument step. It should preserve the underlying logic: molecules are resolved by mass-to-charge behavior, fragments reveal sequence or modification information and the resulting evidence supports identity or product quality. If the campaign is about glycosylation, oxidation, deamidation or clipping, the key modification can become the hero detail.
Commercial teams benefit because mass spec visuals can make advanced analytical capability feel concrete. A prospective partner may not need the raw spectrum in the first meeting, but they do need to understand that the platform can detect the molecular differences that matter. That is where premium 3D scientific rendering can create trust: it makes the measurement visible without pretending the data is simpler than it is.
- Use protein ribbons, peptide fragments and molecular surfaces to show what is being interrogated.
- Avoid fake spectra, fake numbers or unreadable overlays in marketing images.
- Reserve detailed charts for technical slides where axes, legends and method context can be handled correctly.
Stability And Comparability Visualization For CMC Confidence
Stability and comparability are difficult visual topics because the most important evidence often appears across time, batches, stress conditions or manufacturing changes. A table can document the result. It rarely communicates the meaning quickly. Stability study visualization should help audiences see which attributes remain controlled, which degradation pathways are monitored and why the product profile supports the next decision.
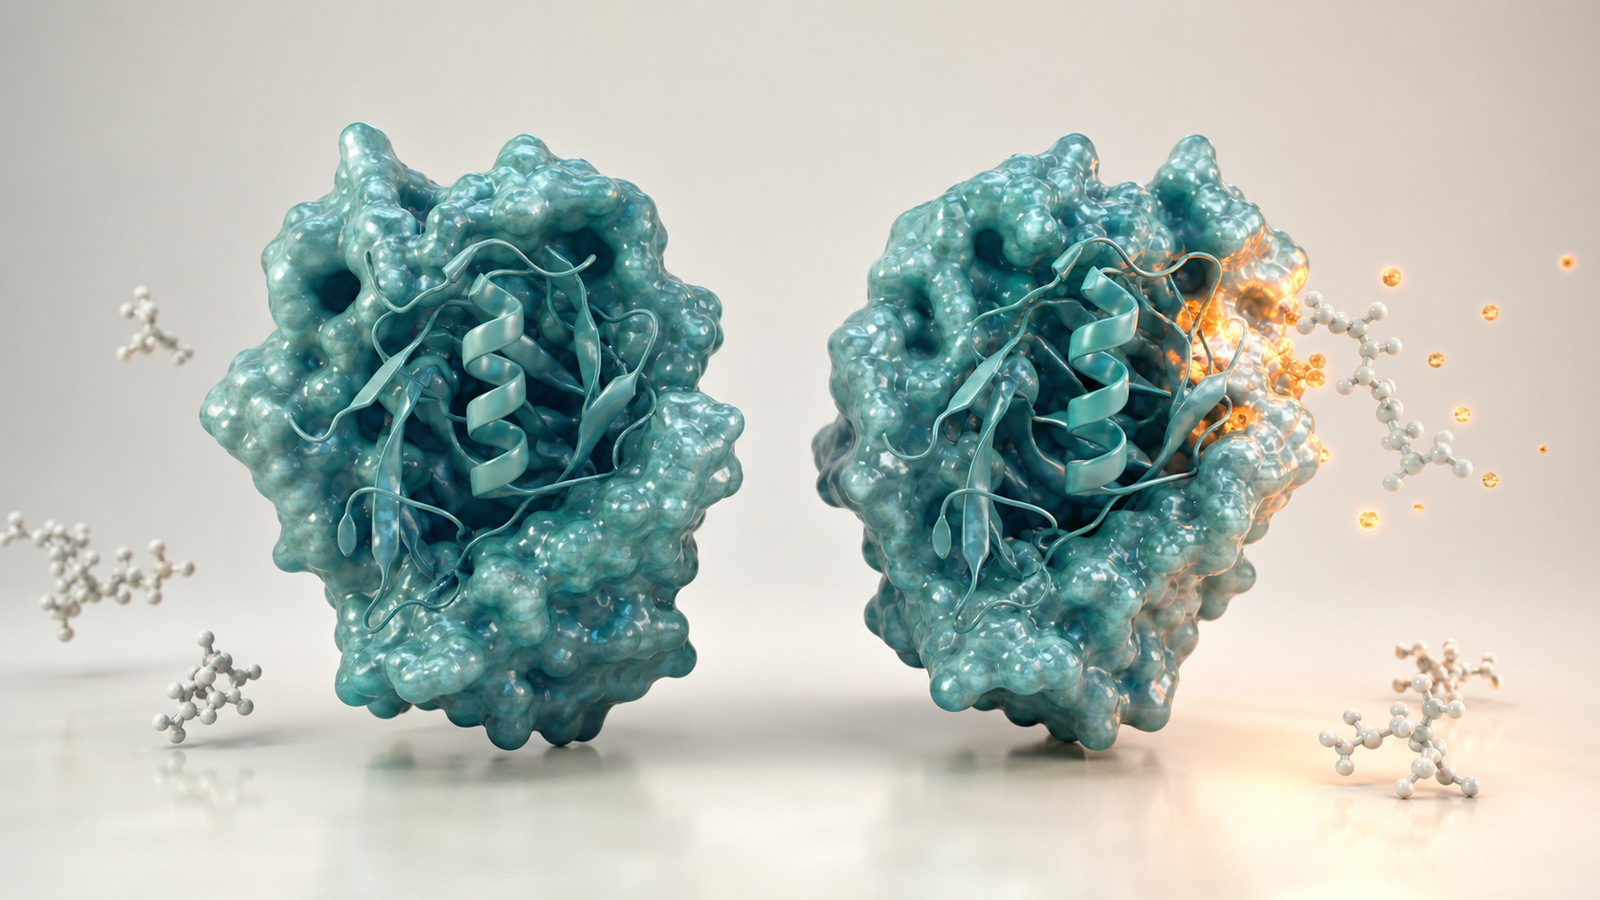
Comparability visualization has a different job. It must show similarity without making the claim feel casual. For biologics and advanced therapies, small differences can matter. A good figure can show pre-change and post-change product profiles as aligned molecular states, matched analytical windows or coordinated evidence streams. The image should make it clear that comparability is based on multiple measurements rather than visual resemblance alone.
The best CMC visuals are calm. They use restraint, clean hierarchy and physically plausible materials. A busy collage of vials, charts and colorful shapes may feel energetic, but it can weaken the scientific claim. A better approach is one central molecular or platform subject with a few supporting forms that represent stress, time, batch alignment or analytical readouts. That style matches how serious biotech teams want to be perceived.
- Stability visuals should distinguish real degradation risk from controlled variation.
- Comparability visuals should show aligned evidence across methods, batches or process states.
- CMC visuals should feel precise, polished and credible rather than decorative.
How Animiotics Builds Buyer Ready Analytical Characterization Visuals
Animiotics starts by identifying the decision the visual must support. A characterization asset for a Series A deck has a different job than a conference loop, scientific sales page, BD one-pager or technical explainer animation. We ask what claim the audience must believe, what evidence supports that claim and which details would distract if shown too early.
Next, we translate the method into a visual structure. HPLC might become a column matrix with product and impurity species separating through space. Mass spec might become a protein-to-fragment evidence path. Stability might become a molecular hero subject under controlled stress. Comparability might become two aligned states sharing a consistent profile. This makes the figure or render commercially useful while keeping it grounded in the science.
The final style depends on the channel, but the principles stay consistent: premium 3D scientific rendering, readable silhouettes, subtle depth of field, restrained color, clear hierarchy and no unnecessary interface decoration. For more examples of related buyer-ready visual strategy, see https://animiotics.com/blog/protein-purification-animation-services-how-to-explain-chromatography-capture-polishing-and-platform-value-clearly/ and https://animiotics.com/blog/bioprocess-animation-services-how-to-explain-manufacturing-scale-up-quality-and-platform-value-clearly/.
- For sales pages, lead with one clear visual proof concept.
- For investor decks, connect analytical evidence to risk reduction.
- For partner discussions, show method confidence without exposing confidential data.
- For conference assets, use motion to connect molecule, method and result.
FAQ: Analytical Characterization Visualization Services
What are analytical characterization visualization services?
AThey are scientific figure, render and animation services that help biotech teams explain quality evidence such as HPLC purity, mass spec identity, stability trends, impurity control, batch consistency and comparability. The deliverables can support websites, pitch decks, conference booths, launch campaigns, technical explainers and partner meetings.
Can characterization visuals be scientifically accurate without showing raw data?
AYes, if the visual is built around the correct claim. Marketing renders can show the molecular or method logic without displaying confidential traces or exact values. Technical slides can then carry the full chart, method details and acceptance criteria where needed.
Are these visuals useful for biologics and advanced therapies?
AYes. They are especially useful for antibodies, enzymes, protein therapeutics, cell and gene therapy platforms, viral vectors, RNA therapeutics, delivery systems and formulation programs where quality evidence is central to buyer confidence.
How early should a company create analytical development visuals?
AThe best time is when a platform claim depends on analytical credibility but the current data package is too dense for non-specialist buyers. That can be before fundraising, ahead of a partnering campaign, during product launch preparation or when a technical deck needs to become more persuasive.
Ready To Turn Analytical Evidence Into Buyer Ready Visuals
Analytical characterization visualization services help biotech teams show quality, control and platform value without forcing every buyer to decode raw methods data. If your HPLC, mass spec, stability or comparability evidence is strong but hard to communicate, the right visual system can make that evidence easier to trust.
Animiotics creates premium 3D scientific renders, mechanism visuals and animation assets for biotech teams that need their characterization story to look as rigorous as the science behind it. Start with the evidence your audience must understand, then build the visual around that decision. See more at Animiotics.
- Use a cover render for the central analytical story.
- Use in-post or slide visuals for HPLC separation, mass spec identity and stability or comparability confidence.
- Keep the visual language restrained, scientific and focused on the buyer decision.